In one of our blogs of Territory management, we saw how Anna, who is the Sales Manager of her organisation, creates the territories so as to assign them to her field sales team. Later, she uses the Alignment tool to align the created territories so as to achieve balanced territory distribution.
Now the management team of her company has decided to expand the business into untapped areas of New York. The management has executed the prerequisite activities based on which they are getting some new leads. In order to handle the newly emerging leads, Anna has to create new territories in these untapped areas so as to assign them to her sales team. With the latest release we have added another powerful feature of Overlay where user can view the records, territories and shape files together on a single screen to analyse. Anna can now use this feature to analyse the existing territories to view the currently tapped areas and the respective customers.
In the below screenshot Anna can see that she has created territories with Postal codes of Staten Island. She can easily see all the existing customers in these territories.

Anna has a census shape file of New York which she needs to plot using Overlay to see the untapped areas with respect to the existing territories and leads. In order to plot the shape file, she needs to save the shape file in a territory. She will have to follow the steps mentioned below for the same.
- Go to Settings > Business Management > Sales Territories > Create a sales territory > Save
- Scroll down to Territory Map Preview > Select By Shape File > Choose the shape file > Save
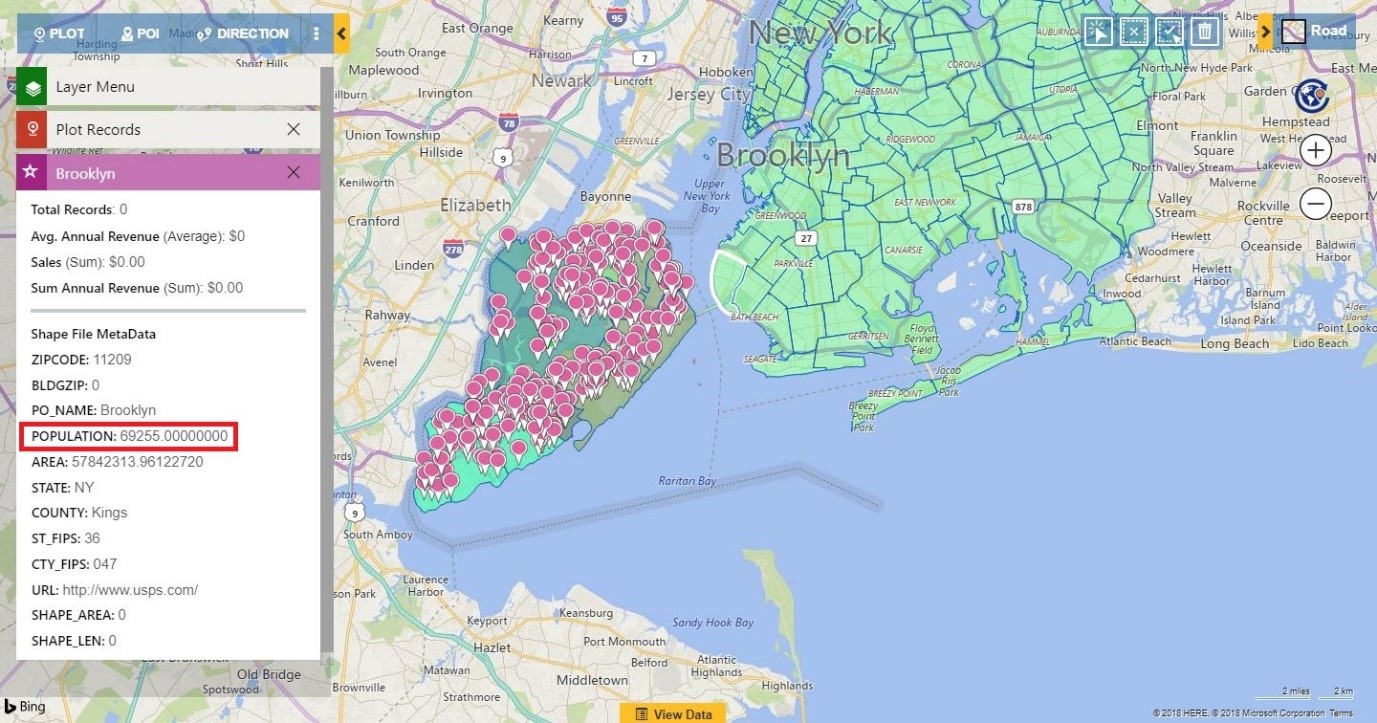
After she has saved the shape file in a new territory, she can now plot the shape file into the overlay along with the customers and the territories. She can also view the data contained in the shape file in the view data grid. In the below screenshot she can easily view the untapped areas of New York. She can also use the layer menu to show/hide the layers plotted on the map.
Anna will now click on the untapped areas to view the data for the respective postal codes. As she clicks on the postal code 11209, the postal codes gets highlighted and a summary card opens up to show the respective data for the postal code. Anna notices that the postal code is having the population of 69255.
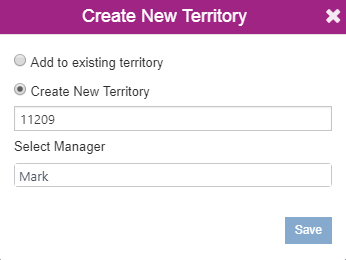
Anna will now use the Alignment tool to select the postal code 11209 and create a new territory for it. While creating a new territory she can also assign this territory to a salesperson. She also has an option of adding this postal code as a Geography to an existing Territory.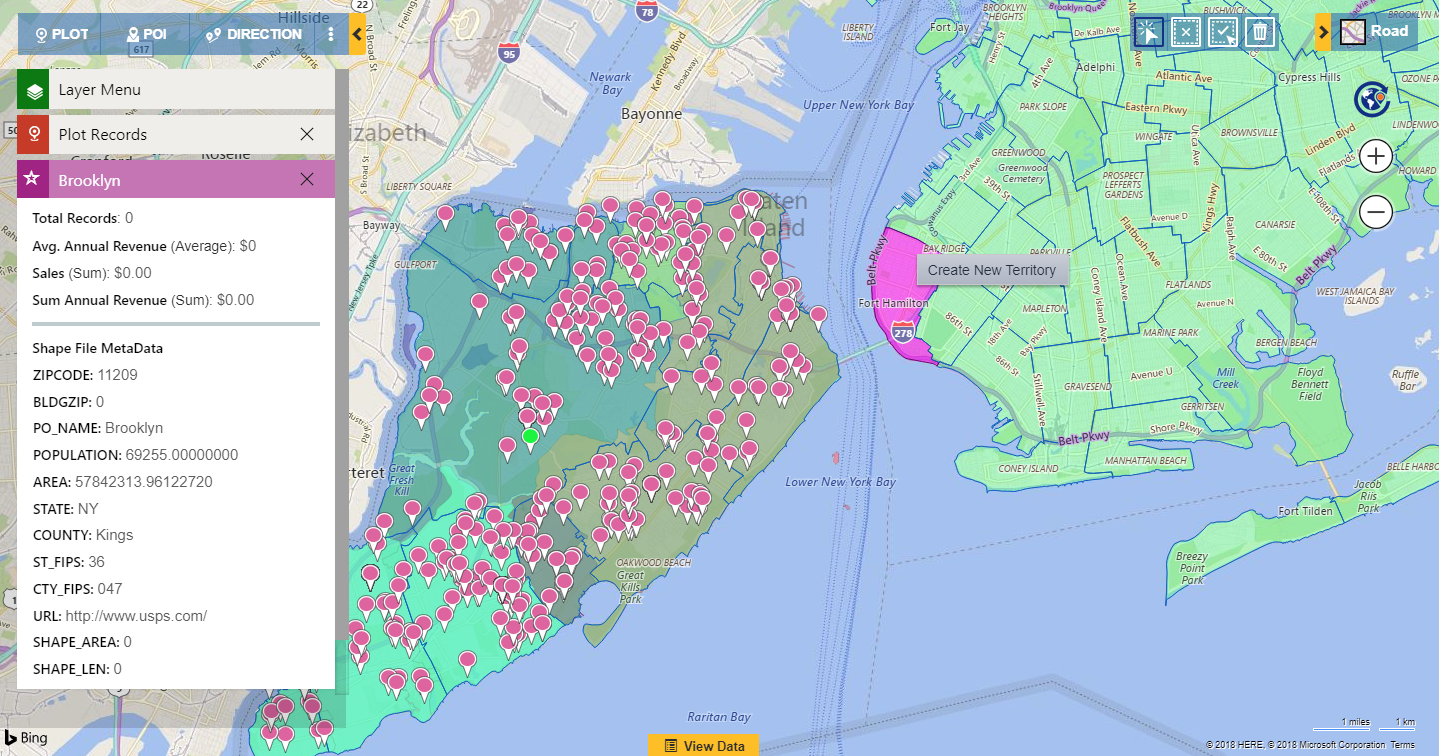
Just like the Postal code 11209, she can click on other postal codes and look for the population number of other postal codes as well. Accordingly, she will now create new territories so as to handle the newly emerged leads and the other upcoming leads in New York.
This way Anna can analyse the geographical areas with a view of records, territories and shape files together on the Detail map and take decision to create territories for her sales team.
Start analysing your Data with the latest feature of Overlay. Start your 15- day free trial of Maplytics today. Click here to download Maplytics solution as per your Dynamics CRM version. Please extract the downloaded folder and go through the ‘Read-Me’ file for quick installation or refer to the video tutorial.


