In our last post we saw how Maplytics helps a sales rep into his day to day activities. We also saw how his Geo-Analytics dashboard helps him to plan and execute the sales process in a modern and efficient way using Maps within Dynamics CRM. In this post, we will explain stepwise how to create a dashboard customized for a sales rep. A dashboard which will give all the essential views that a sales rep needs to have a glance at, which will help to analyze the self-position into sales, opportunities in the market and daily appointments.
A Dynamics CRM dashboard shows real-time business data at a glance. The data can be seen in a comparative manner in the form of graphs, charts etc. These dashboards have a very important value in businesses as they can be used to measure and develop analytics for business reporting. Monitoring of business and sales opportunities, processes and performance become much easier with the help of a dashboard.
With Maplytics, users can add a Maplytics dashboard to a Dynamics CRM standard dashboard. This helps the user to analyze many views of the data visually on a map in one glance through the dashboards. Let’s create a dashboard to understand how it’s easier to compare many views of data. Here we are creating a dashboard for a sales representative on the basis of four parameters. A sales rep is always concerned about his sales opportunities and the plan to convert these opportunities. So, it will be much beneficial for him if he gets a dashboard which helps him with such data at a glance. The screenshot below shows the dashboard which we are going to create.
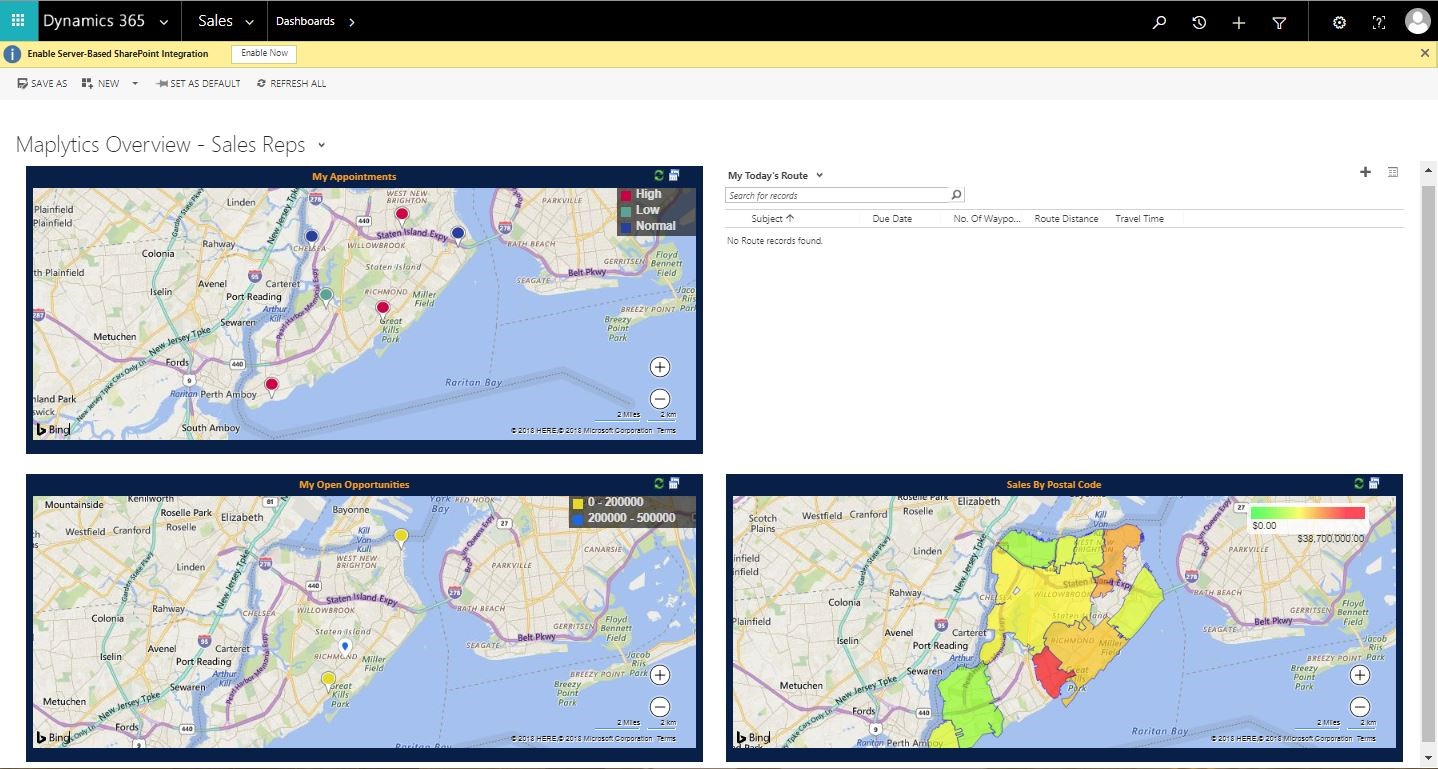 This dashboard will show the data in four parameters: Appointments for the day, Routes, Open opportunities and sales performance.
Let’s start with the Maplytics dashboard for the first parameter which is ‘My appointments’. For this, we need to follow the steps mentioned below:
Settings > Dashboard details > New
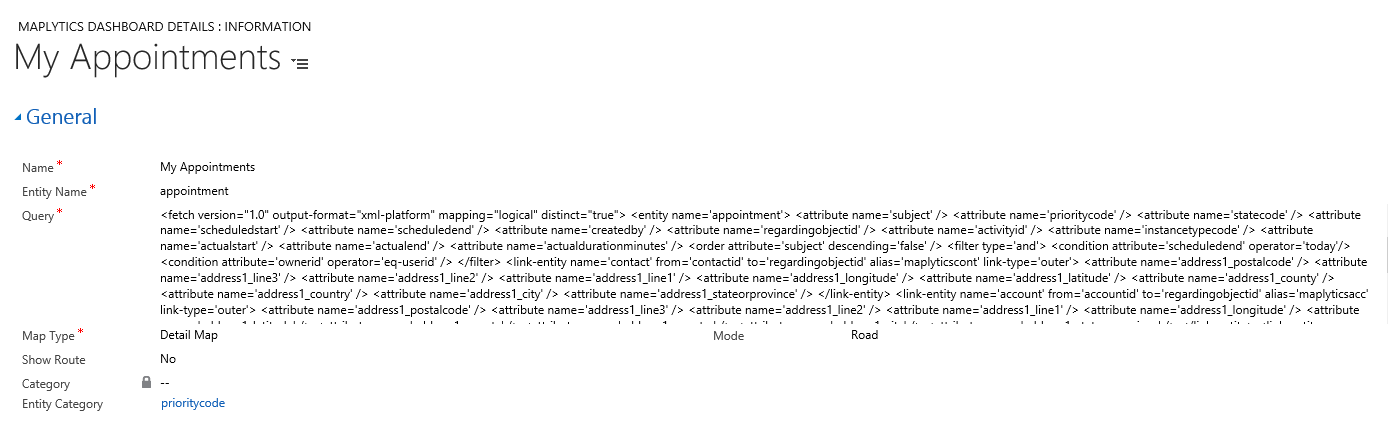
- Name: This is a Unique name for the Dashboard. The user will use this name to define the view to be included in the Dashboard. Let’s save the name as “My Appointments”
- Entity Name: This is the logical name of the entity for which the view is to be configured. Follow the steps mentioned below to get the logical name:
Go to Settings > Customisations > Select entity > Name
Here the logical name of Appointments is “appointment”.
- Query: This is the FetchXML query based on the view to be plotted on the Map. Here we are creating the dashboard for the view “My Appointments”. The user can create a query using Advanced Find. After searching for the query, the user needs to include the address fields in the query for the map to be able to read the geocoding information and plotting the map. The address needs to be fetched either from Accounts or Contacts. Follow the below steps to include the address fields:
If the entity is linked to Accounts: Edit columns > Add columns > Record type > Select ‘Regarding (account)’
Tick the check boxes for:
- Address 1: Street 1
- Address 1: Street 2
- Address 1: Street 3
- Address 1: City
- Address 1: State/Province
- Address 1: ZIP/Postal Code
- Address 1: Country/Region
- Address 1: Latitude
- Address 1: Longitude
Likewise, if the entity is linked to Contacts: Edit columns > Add columns > Recode type > Select Regarding (contact) and tick the check boxes for all the address fields.
In this case, the Appointments can be linked to an account or a contact, we are including the address fields for both Accounts and Contacts.
Note – The record type should be a field from where the address is to be fetched. Also, the address fields should be of the field selected. Make sure that at least of mandatory fields should be selected for the query.
Download the generated FetchXML.
Note: In the queries, when the address data needs to be read from the customer (i.e., it could either hold an account or contact lookup), we need to provide the alias as ‘maplyticsacc’ when a link to a potential customer (account). For contact give alias as ‘maplyticscont’ when a link to a potential customer (contact) or If the address data needs to be read from another OOB or custom entities then you need to provide the alias as “map”.
Enter the query in the space provided.

- Map Type: User can choose the type of the map, they want to see:
Detail map representation – Plots the pushpins for the individual Dynamics CRM records
Heat map representation – Represents the heat of the records
Here we are need a ‘detail map’.
- Category: This is the logical name of the attribute to be used for categorization of the result set. Each unique value of the category would be plotted in a different color.
Note: This attribute should be present in the query.
- Entity Category: Lookup of the entity category record if the user wishes to use the pre-defined colors for the categories. Here we have already set a category configuration based on the priority of the appointment. So, we are giving the logical name of the priority field of Appointment which is “priority code”.
- Mode: User can choose the default mode in which the map should be presented. One can choose, Aerial or Road. We have chosen ‘Road’ here.
- Show Route: This option is available when you choose ‘Detail Map’ option in the Map Type. This provides a shortcut button on the Dashboard to quickly create the route. The user can build a route for maximum 25 waypoints. Since the sales rep is only willing to see the appointments, here we have selected “No”.
To make it easier to understand, we have made the rest of the part much similar to our entity map.
- Attribute Mapping: In the attribute mapping tab, the title contains the logical name of the field attribute which should be shown on hover on the pushpin. The rest are the logical names of all the address fields to be used to plot the map. If the link to attribute is specified, then the address attribute should be of that linked entity.
Note: Before proceeding ahead for the ToolTip Mapping configuration, fill up all data and click on save button.
- Tooltip Mapping: Maplytics will populate the public views of an entity that the user has specified in the Entity Name. The user can select a view from ‘Select a view’ As the user selects a view, Maplytics will populate the fields (columns) that have been defined for that view in the ‘Available Fields’. To make it much informative for a sales rep, we have added, Regarding, Start time, End time, Status, Owner, Priority fields here.

- Advance Settings: In this section, the user can define the attribute that should be visible for a quick glance when you hover over a particular pin on the map. Here we have added the field attribute status. The user can also configure the Heat Map Measure color scale (Low, Medium and High).

After saving, one can see the preview at the bottom.

Likewise, we can create Maplytics dashboard for ‘My open opportunity’ in a detail map and ‘Sales by postal code’ in a heat map.
Now that we have created the required Maplytics dashboards, we have to combine all in a CRM dashboard so as to have 4 parameter view at a glance.
In case of creating a dashboard for any other module, one can follow the steps mentioned below:
Go to Module > Dashboard > New
As we are creating a sales dashboard we have to follow the steps mentioned below:
Go to Sales > Dashboard > New > Choose layout
As mentioned above we are creating the dashboard with 4 parameters, we have selected a layout of 2 column regular dashboard and then click on create.
Let’s click on the web resource icon which shows ‘insert web resource’ to add the web resources of the Maplytics dashboard.

This opens the web resource properties which looks like below:

Web resource: Select the web resource of Maplytics dashboard. Choose “ikl_/Maplytics/Maplytics.Dashboard.html” as the web resource to be used.
Field Name and properties: Users can give a label here. We have given the label ‘My appointments’
Web resource properties: This an important step here. User has to enter the name of the Maplytics dashboard in Custom parameter. We have given ‘My Appointments’, the name we had given while creating the dashboard.
Likewise one can add the other two Maplytics dashboards – My open opportunities and sales by postal code.
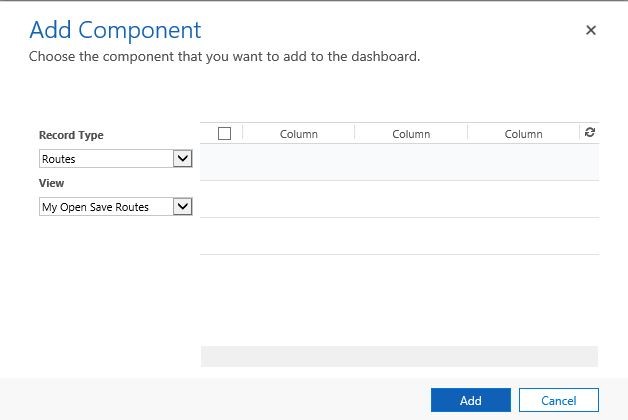
For the route parameter, we can click on the ‘list’ component and select Record type as “Routes” and View as “My open save routes” and click on add. This will add a section which will show the routes assigned to the sales rep.

After adding all the web resources the dashboard looks as follows:
We have assigned a route to the sales rep so as to show the use of the route component as well. Click here to know how to assign a route to a user. The route with the name ‘ Route 1’ is visible in the route component below.

This is how a dashboard is created for a sales representative. Users can surely add other parameters to view other information as well in a single dashboard at once.
Click here to download Maplytics solution as per your Dynamics CRM version and start your free trial now!


