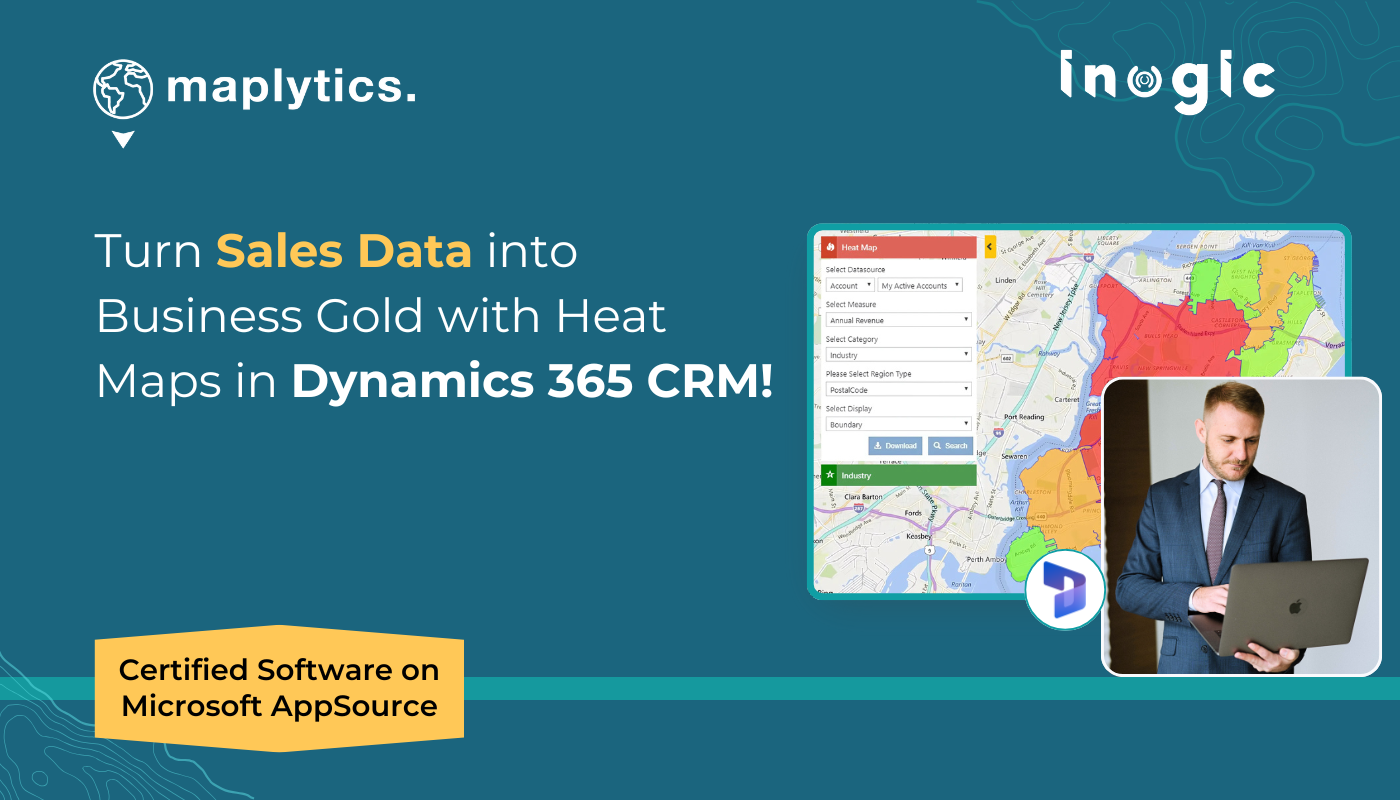
If you’ve ever stared at a sales report and wondered, “Okay, but what does this mean for the location?”, you’re not alone. Numbers tell a story, true, but they don’t always show you the real & complete picture.
Bring in heat maps in Dynamics CRM, where your data stops being static rows in a spreadsheet and starts becoming a living, breathing map of visible opportunities.
With Maplytics inside Dynamics 365, you can see where your customers are, where sales are booming, and where gaps exist without exporting data or juggling external tools. Let’s dive into how heat maps are quietly becoming the unsung hero of smarter business decisions.
What Exactly Is a Heat Map and Why Should Sales Teams Care?
Think of a heat map as a weather forecast for your sales pipeline. Instead of clouds and storms, you see customer clusters, revenue hotspots, and cold zones of opportunity.
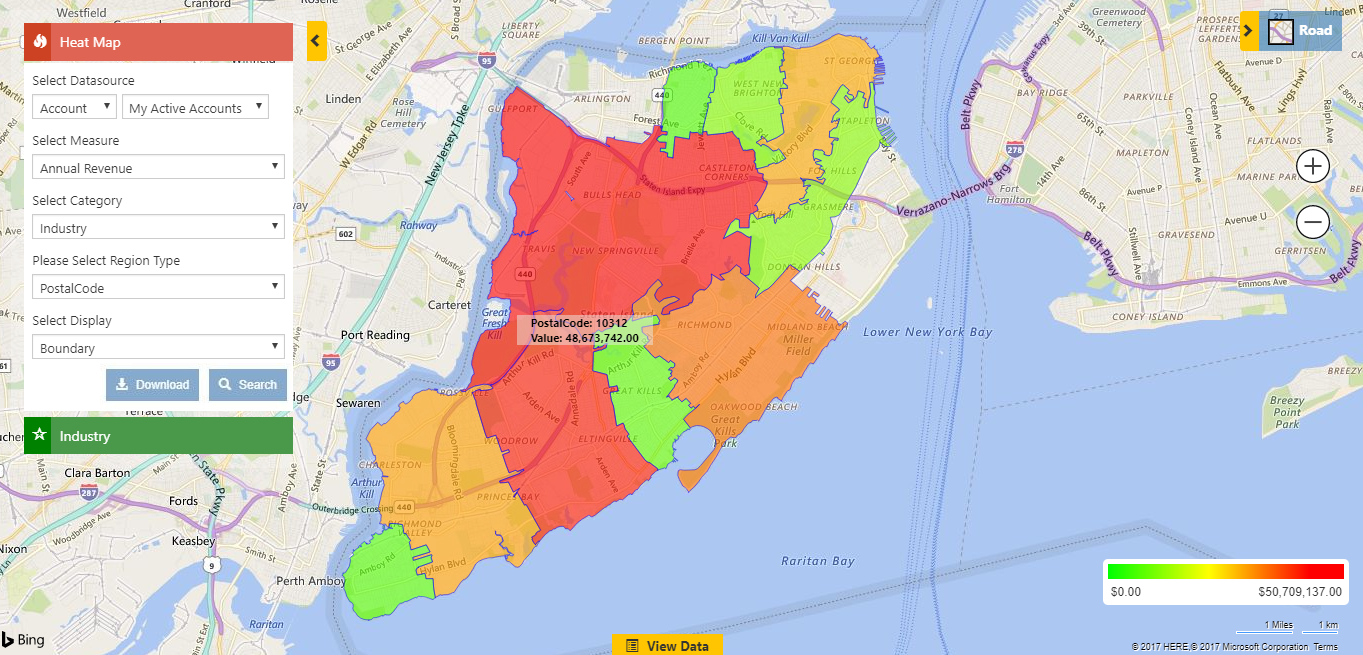
• Red zones? That’s where your business is hot.
• Green zones? Potential growth areas waiting for attention.
• Yellow zones? You are doing well, but can do better. Increase efforts!
And the best part? You don’t need to be a data scientist to use them. With Maplytics inside Dynamics 365 CRM, you can generate heat maps in seconds, directly from your CRM records, and instantly see where to focus your strategy.
Why Heat Maps Are a Game-Changer
Let’s be honest, traditional CRM dashboards are powerful, but they often stop short. You know how much revenue you made, but do you know where it came from? That “where” can completely change how you plan your next move.
From “Where are our customers located?”
To “Why aren’t we already on the fastest route to visit them?”
Sales conversations have officially entered the geo-intelligence era.
Enjoy the shift!
Here’s what heat maps unlock:
- Spot clusters of leads or customers in areas you didn’t even realize were active.
- Avoid overloaded reps in one region and idle reps in another.
- Target campaigns by geography and requirement, not guesswork.
- Compare this quarter’s hotspots with last quarter’s to measure progress.
In other words, heat maps bridge the gap between knowing your numbers and acting on them.
How do Heat Maps appear in Action?
Let’s paint a quick picture.
Imagine you’re a regional sales manager at a software company. You open Dynamics 365 and generate a heat map of all active opportunities. Immediately, you see-
- A red cluster around Chicago- clearly a hotbed of interest.
- A light green patch around Cleveland- room to grow, but under-serviced.
- Scattered leads along Detroit- maybe they need a closer look.
From here, you can:
- Assign extra reps to Chicago to close deals faster.
- Launch a local campaign in Cleveland to boost traction.
- Plan meetings & a route for your Detroit rep to maximize efficiency.
All without leaving CRM. That’s the power of turning maps into action.
Business Use Cases That Just Work
Heat maps are not just “cool visuals.” They deliver real impact across industries:
- Retail & Consumer Goods
Track sales density to decide where to open the next store, or which existing store needs more marketing.
- Pharma & Healthcare
Identify regions with high prescription activity for what kind of pills, or patient clusters, to optimize distribution.
- Insurance & Finance
Spot claim-heavy regions for better risk analysis or to allocate field agents strategically.
- Field Service
See where service tickets pile up for which skills. Assign technicians accordingly, reduce wait times, and delight customers.
In short, if location matters to your business, heat maps matter to your decisions.
Why Do It in Dynamics 365 with Maplytics?
Other tools can build heat maps, sure. But here’s what sets Maplytics apart:
- You don’t need to export data. It’s all inside your CRM.
- You can act instantly, create routes, plan territories, or schedule visits right from the map.
- It’s built for everyone: sales, service, marketing, and leadership teams.
- Maplytics offers its exclusive services for the Microsoft Environment
Think of it as a Swiss Army knife for your CRM data: visualize, analyze, and act in one go.
The real win isn’t just spotting patterns; it’s about what you do next. With Maplytics:
- A rep sees a dense lead cluster- generates an optimized meeting schedule and routes in one click.
- A manager notices uneven performance- redraws territories to balance workload.
- A marketer identifies a hotspot- runs a hyper-local campaign in days, not weeks.
It’s not just heat maps. It’s heat maps that drive action.
To Sum Up—
Sales data alone is like puzzle pieces scattered on a table. A heat map puts them together, showing the bigger picture. With Maplytics heat maps inside Dynamics 365, businesses move beyond reports and into real-world insights.
What’s More?
Maplytics is like water that can be moulded into any shape. It makes Bing Maps and Azure Maps integration within Dynamics 365 look seamless. Radius Search, Route Mapping, and more have become super easy to use. To get more acquainted and experience it first-hand, one can write to crm@inogic.com. To investigate the product further with a personalized demo within Microsoft Dynamics 365 CRM / Dataverse, get in touch with the team. For applied knowledge, visit our Website or Microsoft AppSource. One can hop onto the detailed Blogs, Client Testimonials, Success Stories, Industry Applications, and Video Library for a quick query resolution. You can check out our technical tutorial video series #KnowYourMaplytics here, and for fun Tips & Tricks about Maplytics, have a look at our series #ProAtMaplytics here. Technical docs for the working of Maplytics are also available for reference.
You can also leave us a review or write about your experience on AppSource or the G2 Website.


