Heat Maps has always been a powerful tool to get geographical insights of Dynamics CRM data using Maplytics. With the spectrum of colors representing the measure/density of the Dynamics 365 data, heat maps not only looks beautiful but proves equally functional for an organization.
The insightful heat maps visualizations created based on the color scale, helps organization to understand their business geographically and make informed data driven decisions.
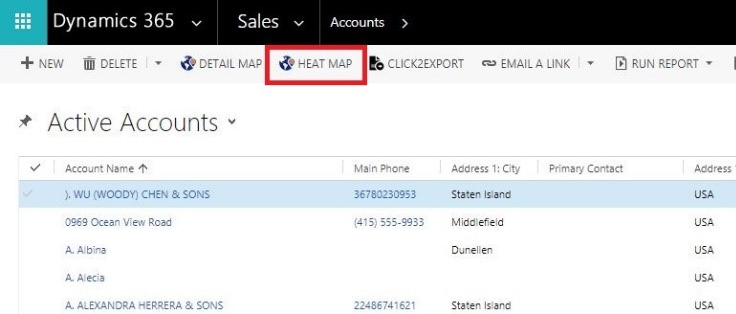
Maplytics allows the user to access the heat map using the heat map button present on entity homepage.
In an organisation, an essential part of management is to monitor the sales and make effective strategies to further increase it.
The managers would like to see a number of factors that contribute in regards to sales. For example, how many open opportunities are there, how many open cases are to close and ultimately how much annual revenue is generated in different regions?
They can easily use the heat map visualization in Dynamics CRM to analyze all of these factors geographically. Now, if they want to analyze the Annual revenue for each region, they would like to see the areas having lesser revenue in Red color and the areas with higher revenue in Green color.
Maplytics has now made this possible for users. With the latest release, we have provided an option to modify the color scale for various ranges of attributes.
Modifying Heat Map Color Scale in Maplytics:
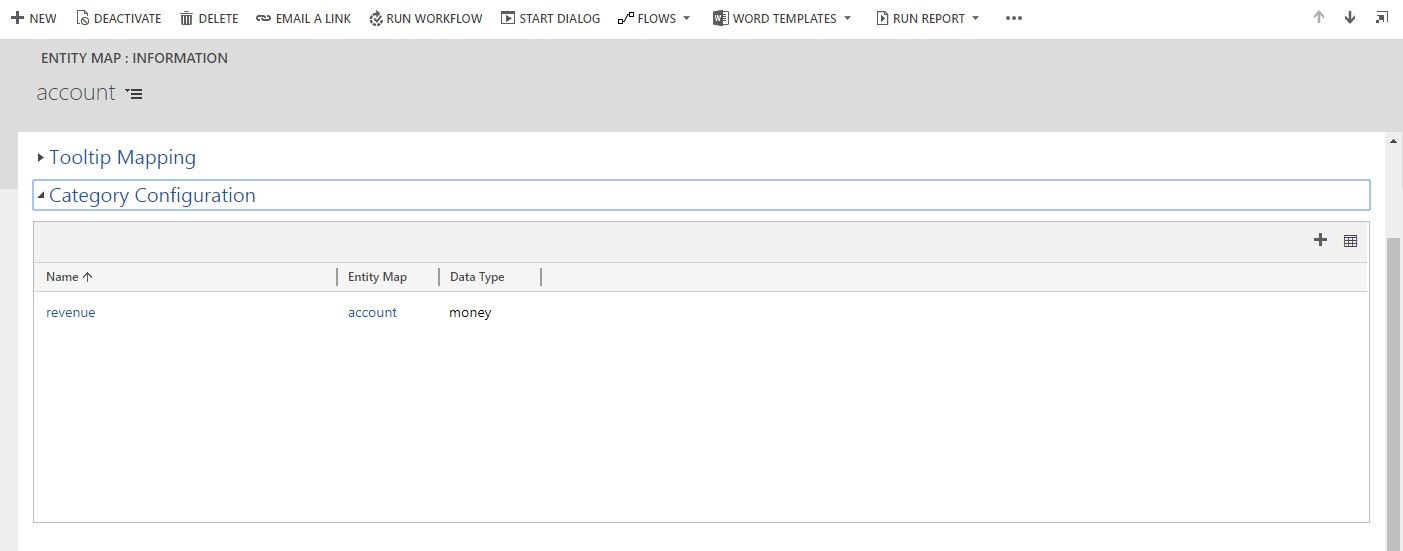
1. First, we need to set the category for the entity under category configuration. Go to Settings> Entity maps > Accounts > Category configuration. Here we have chosen Annual revenue as the category.
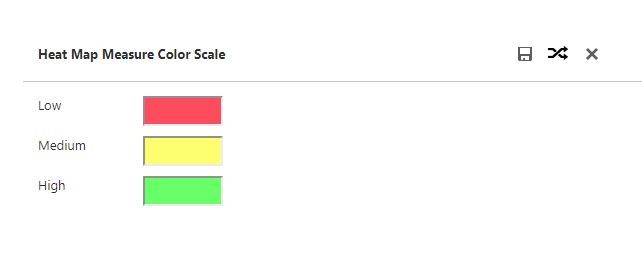
2. Click on Annual revenue. Now, we can modify the color scale for this attribute and save it. Here we have chosen Red, Yellow and Green for Low, Medium and High ranges respectively.
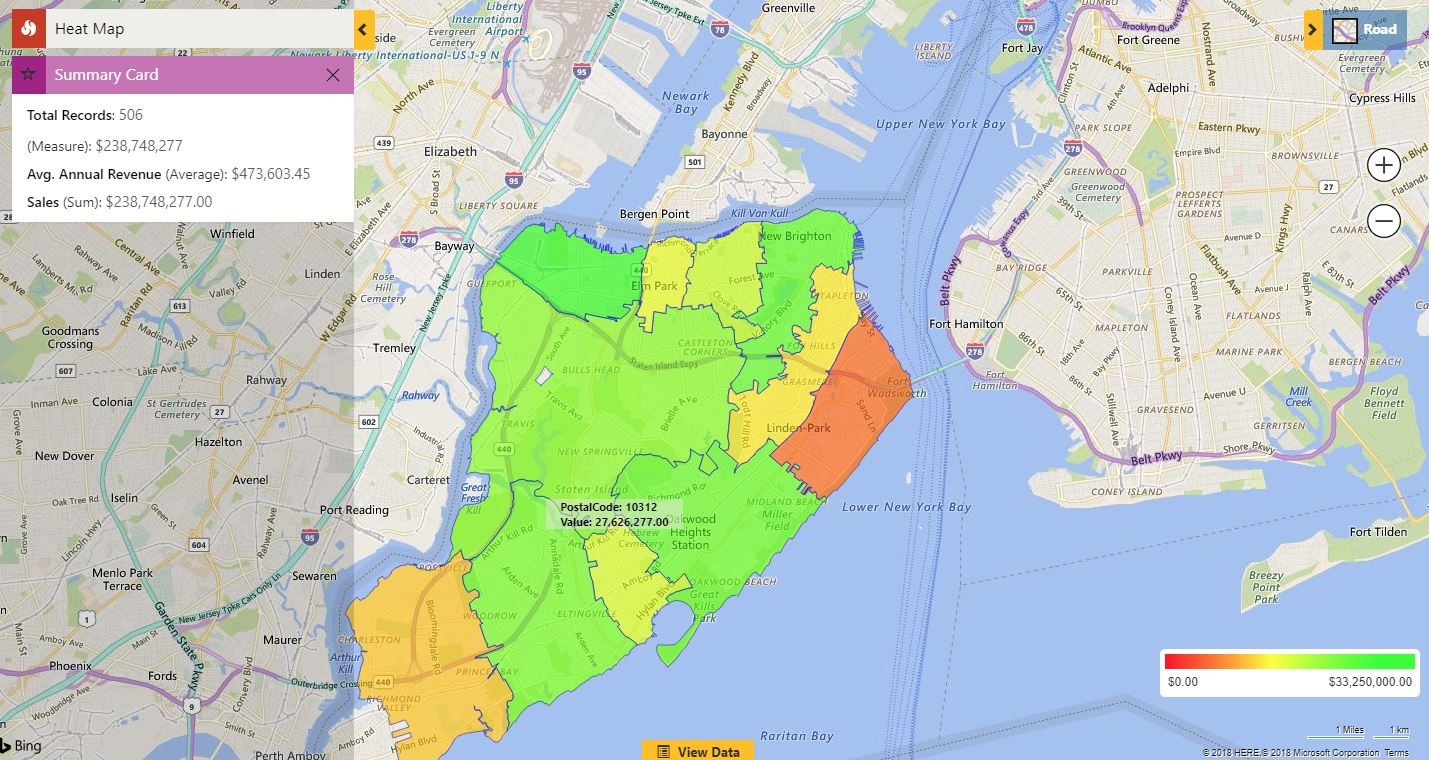
3. This will now allow us to visualize Dynamics CRM data with the modified color scale as shown in the screenshot below.
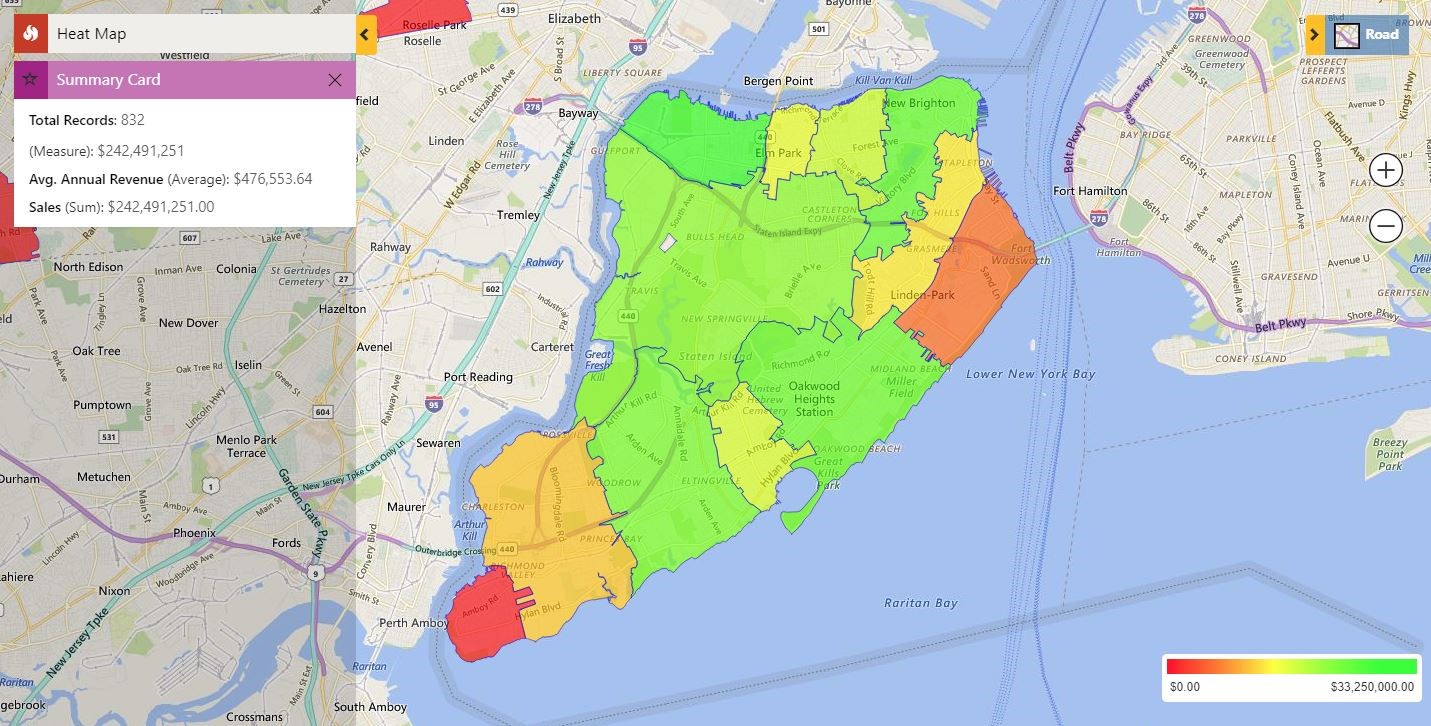
In the screenshot above, we can see that the regions with low Annual revenue are shown by colors Red and Orange and the regions with higher Annual revenues are shown by colors Yellow and Green as set in the Entity map.
Drill-down Regional Analysis with Summary Card on Heat Maps:
To make the heat maps more insightful, we have also introduced Summary Card feature that was available on the Detail Map on the Heat Map as well.
Now, whenever users visualize Dynamics CRM data on heat map, a default Summary Card, aggregating the information for all the regions opens up.
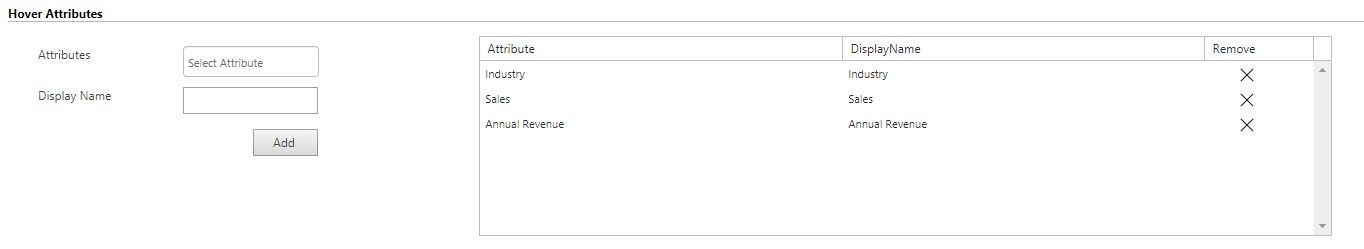
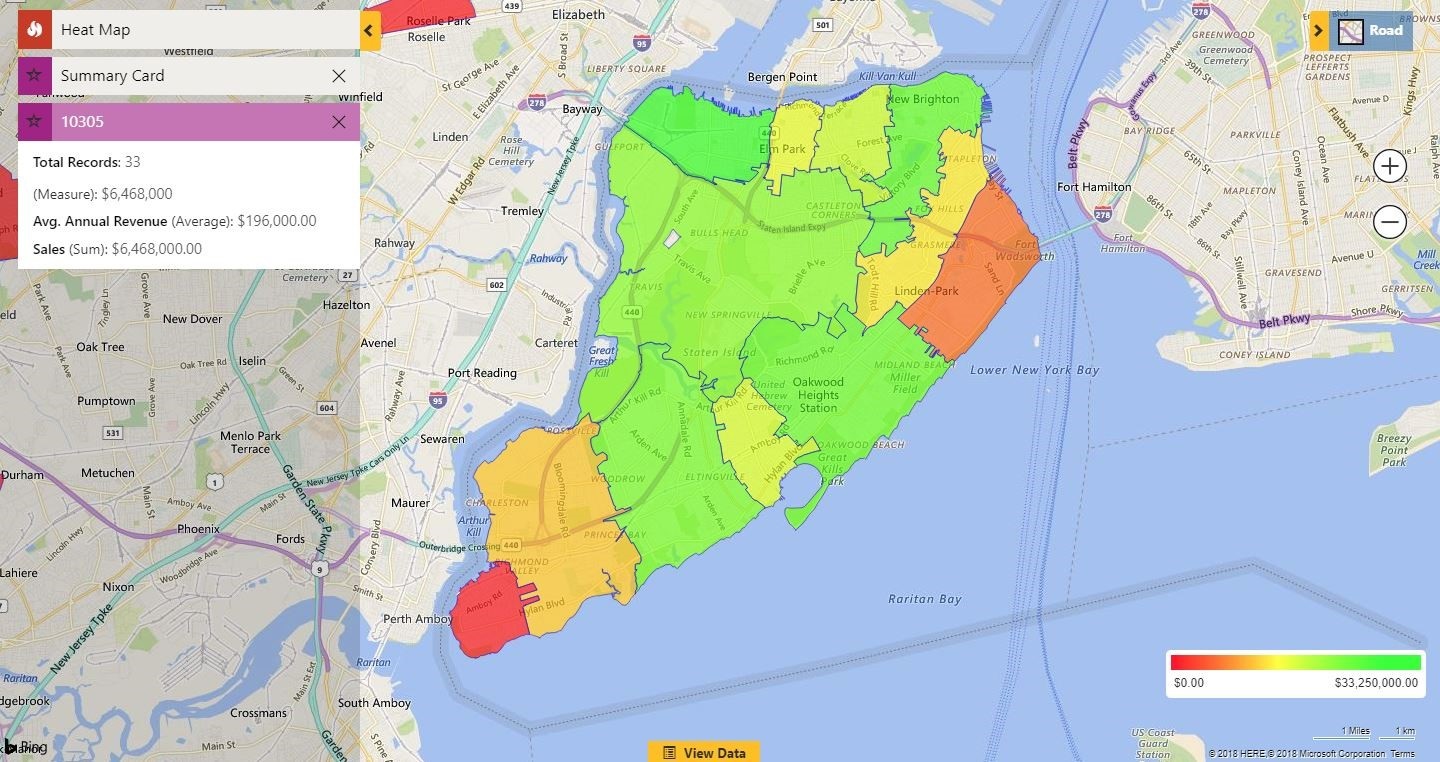
If the user clicks on any of the enclosed areas on the map, a Summary Card with information about that area will open. The user can also select which information should be shown on the summary card as shown below:
With the ability to modify the color scale based on organization’s preference, users can get better visual understanding of their Dynamics CRM data and with the addition of Summary Card feature, they can further drill down into individual regions and get actionable insights.
Get started by downloading a free trial from our Website.
Happy Mapping!


