Dashboards are a perfect way to get a quick overview of your Dynamics 365 data. It gives a centralized view of actionable business data that can be easily accessed by the users. It assists sales managers in obtaining critical information on their sales team’s performance. Geo-analytical dashboards make it simple to view and analyze Dynamics 365 data on a map for any entity, opportunity, lead, or account.
To further improve the data visualization experience of CRM users, we have provided an option of adding templates in dashboard in our January 2022 release. This option of Maplytics will prove to be very useful for users to save their crucial time who frequently need to check the results of the same search. Additionally, they can perform Maplytics operations while viewing the saved template on the dashboard.
Let us see through a use-case how this new option can be used to easily visualize CRM data.
John is the manager of the company S D Automations which makes control systems to fulfill the need of different industries like manufacturing, transportation, banking and others. The company has made a new tool for the use of manufacturing companies. To promote the product, John is organizing a seminar and wants to invite the nearby manufacturing companies to show them how the new tool can bring perfection to their finished products.
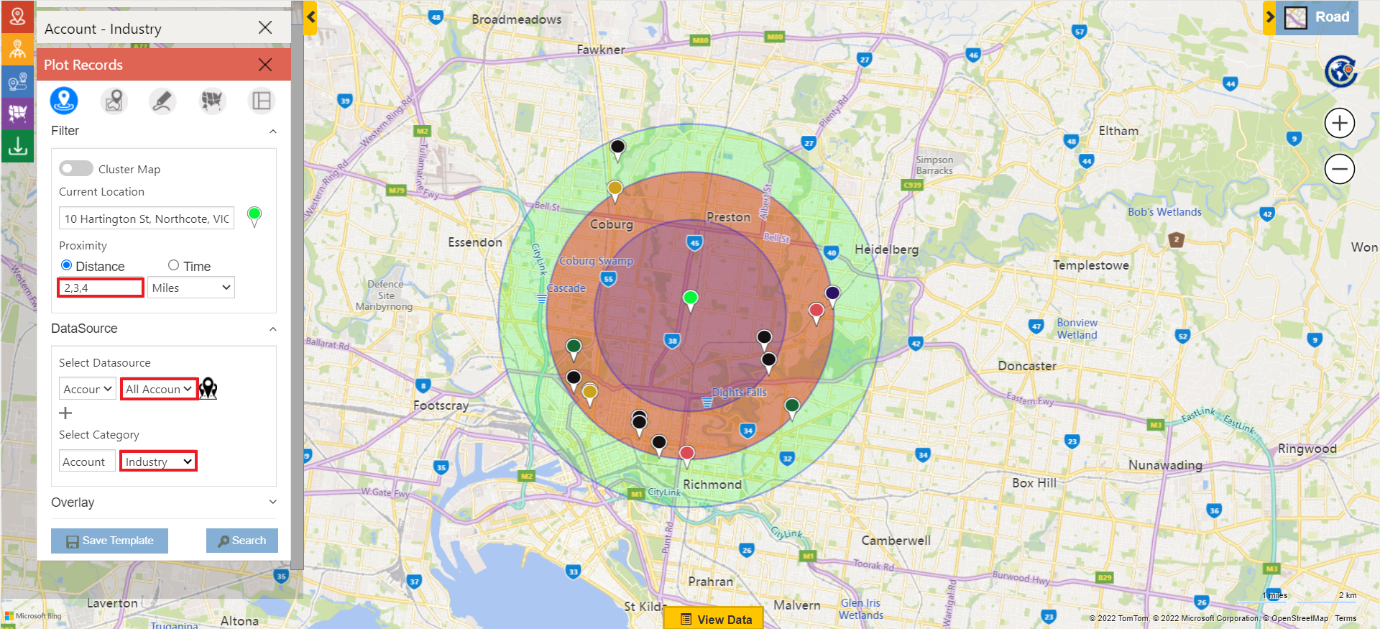
At first, John goes to ‘Maplytics App’, opens the Detail Map, selects Datasource and then performs Proximity Search to visualize all the nearby CRM records on the map. Also, he selects Industry as the Category attribute to color code the records based on the industries as shown in the image below.
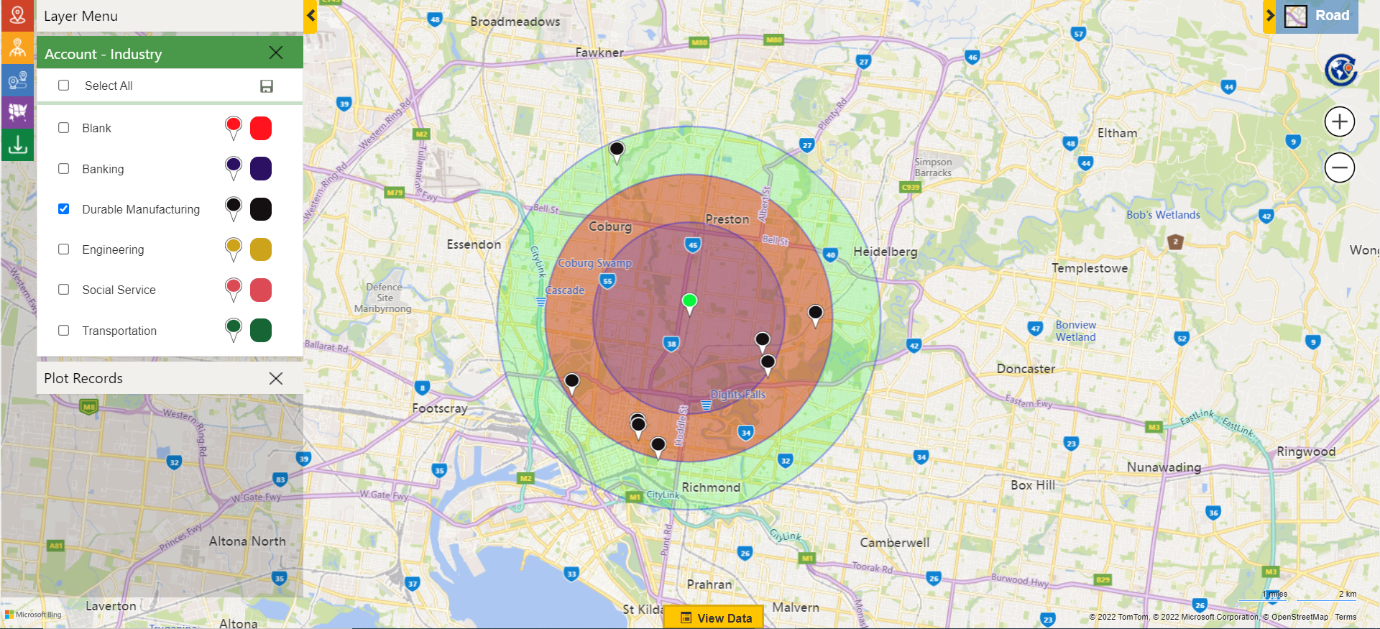
Next, from the Category Card, he will deselect all the industries except ‘durable manufacturing’ as he wants to send invitation only to the manufacturing companies.
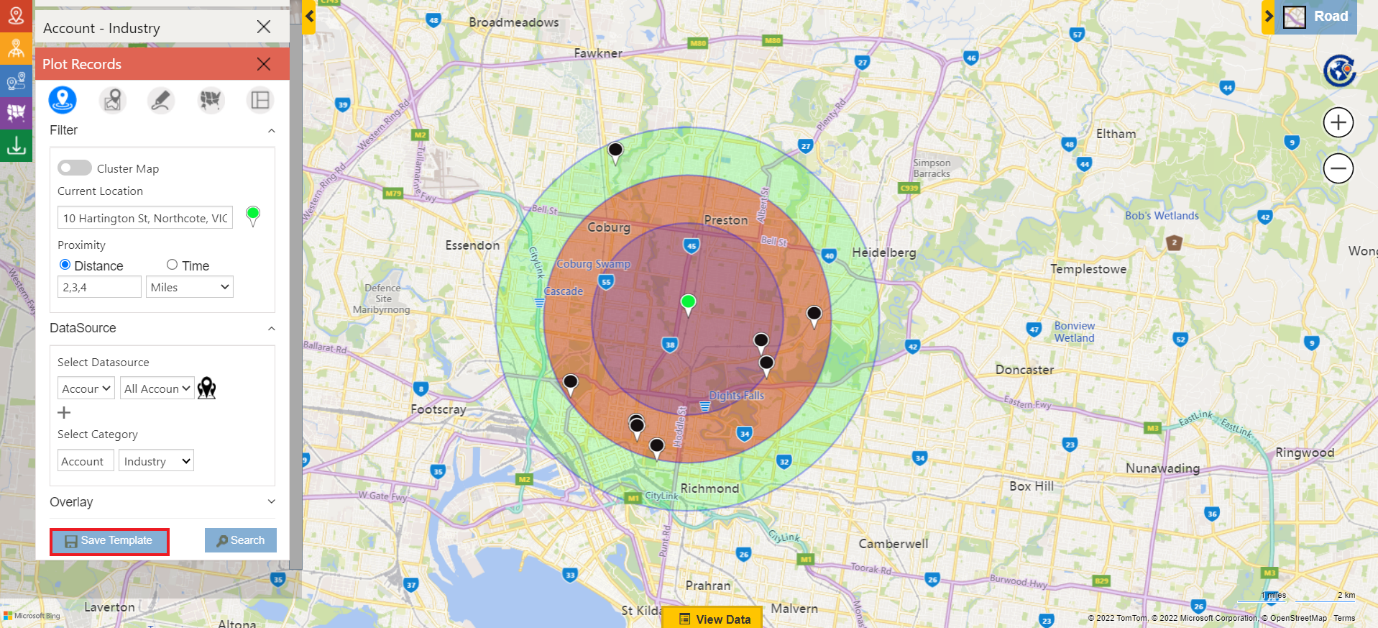
Now, John saves the search criteria by clicking on Save Template option in ‘Plot Records’ card.
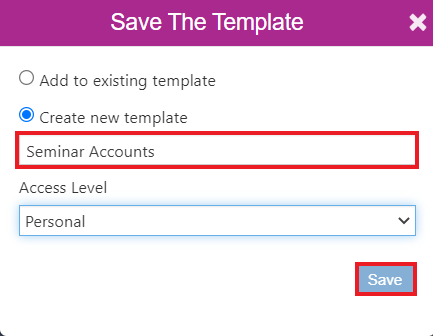
He gives the name as ‘Seminar Accounts’ to the template and clicks on Save options.
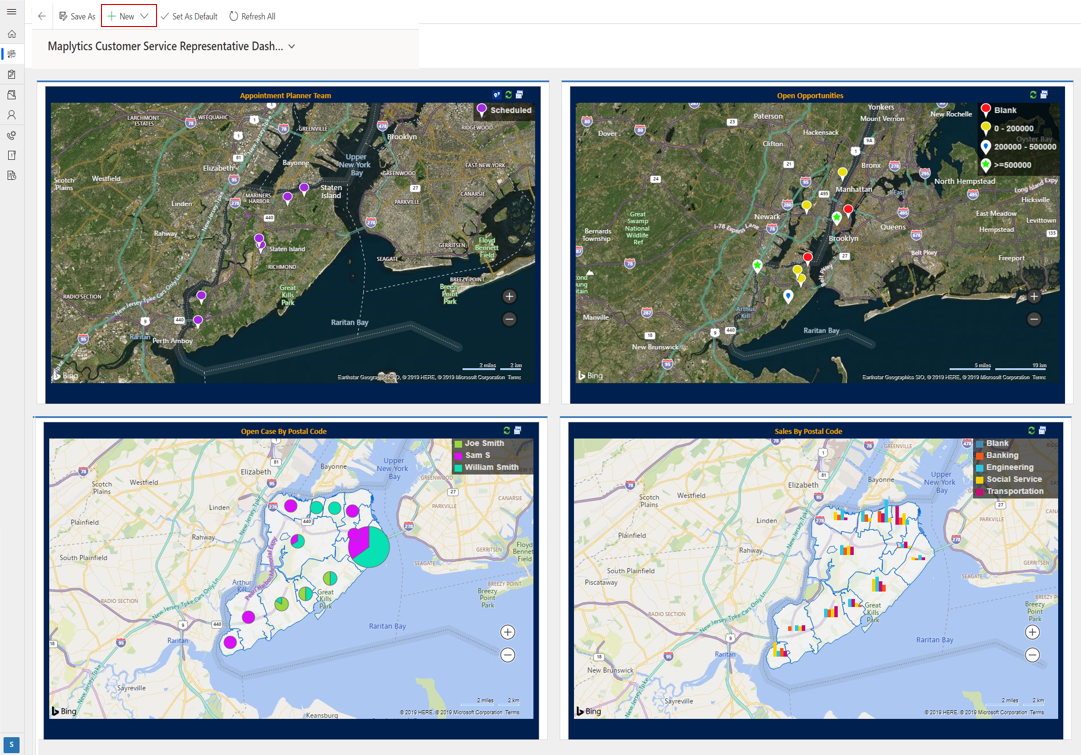
Now to add the template to Dashboard, John follows these steps – Sales > Dashboard > New.
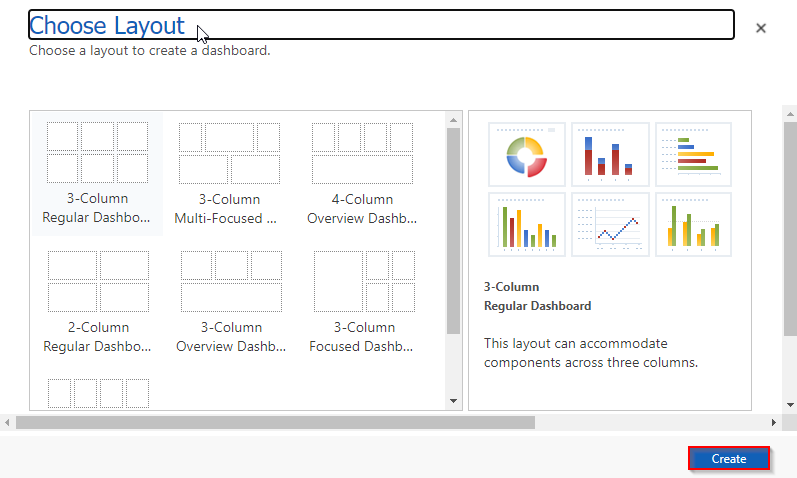
Then Choose Layout window comes up on screen. He clicks on one of the layout options and then selects Create.
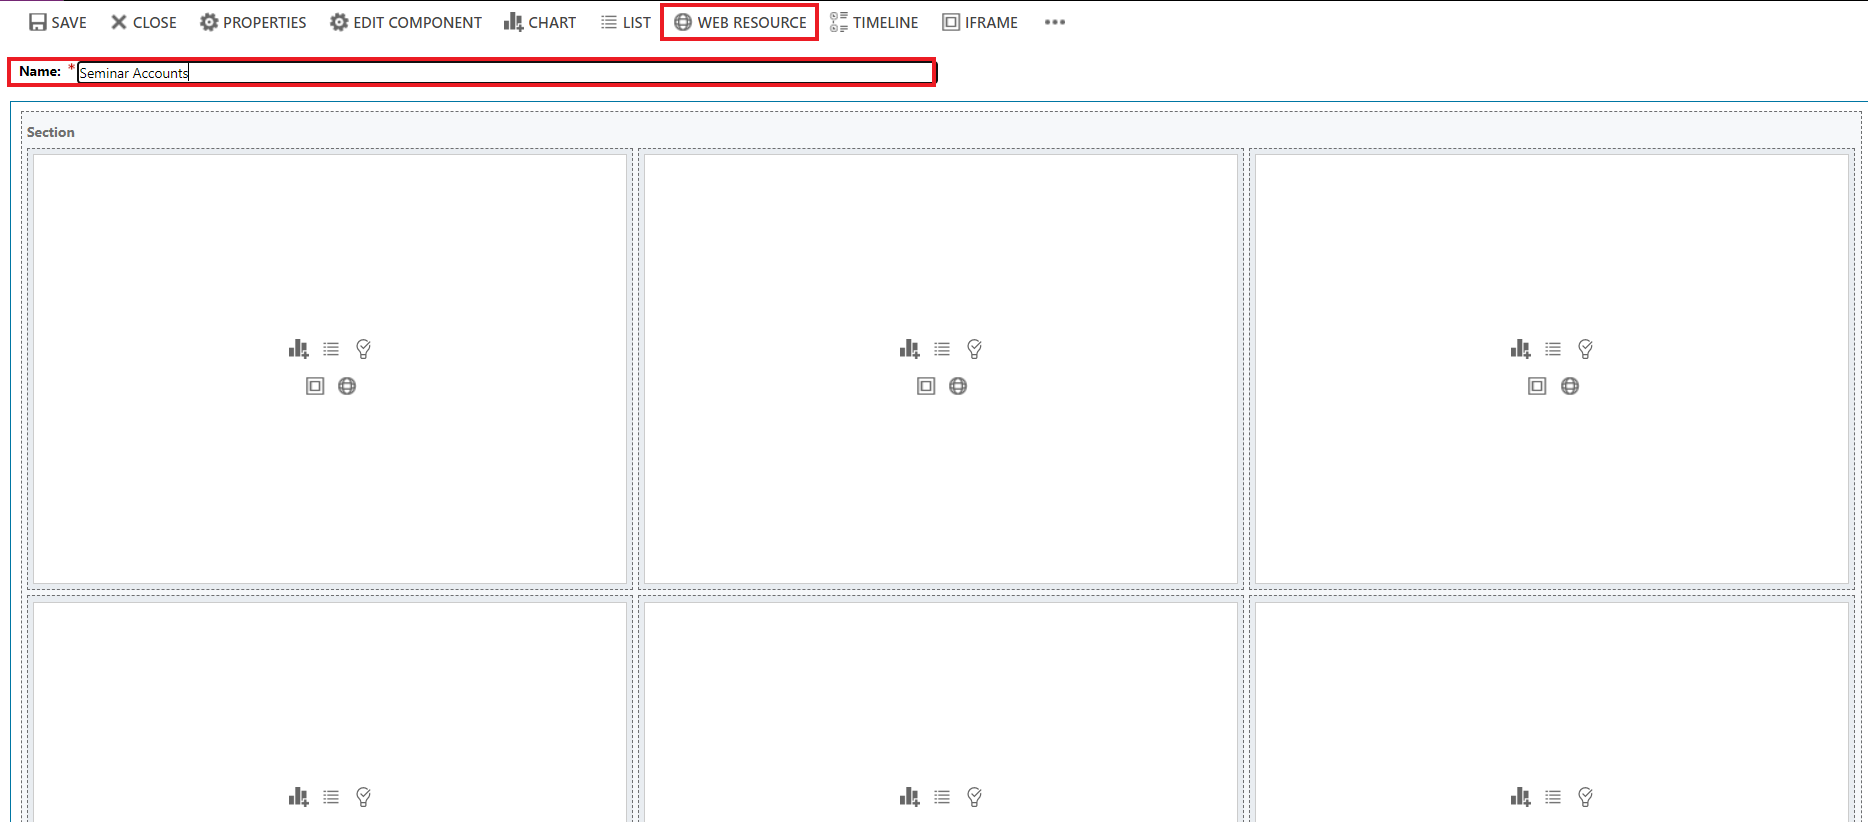
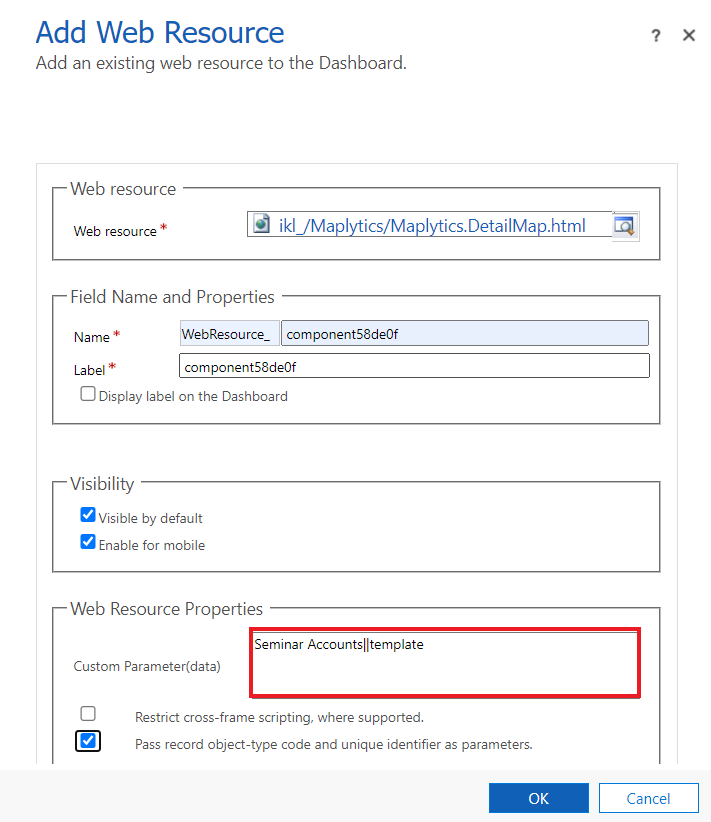
PowerApps window comes up on the screen. To add the template, John enters the name of the template. Then, he clicks on the Web Resource button.
To include the Maplytics Detail Map component on the Dashboard, John adds this ‘ikl_/Maplytics/Maplytics.DetailMap.html’ web resource in Webresource field. Then the data in Name and Label field comes up.
John then needs to provide custom data parameter having template name. The name of template “Seminar Accounts” should be given as – Seminar Accounts||template. Clicks ok and Save. Then closes the Powerapps window.
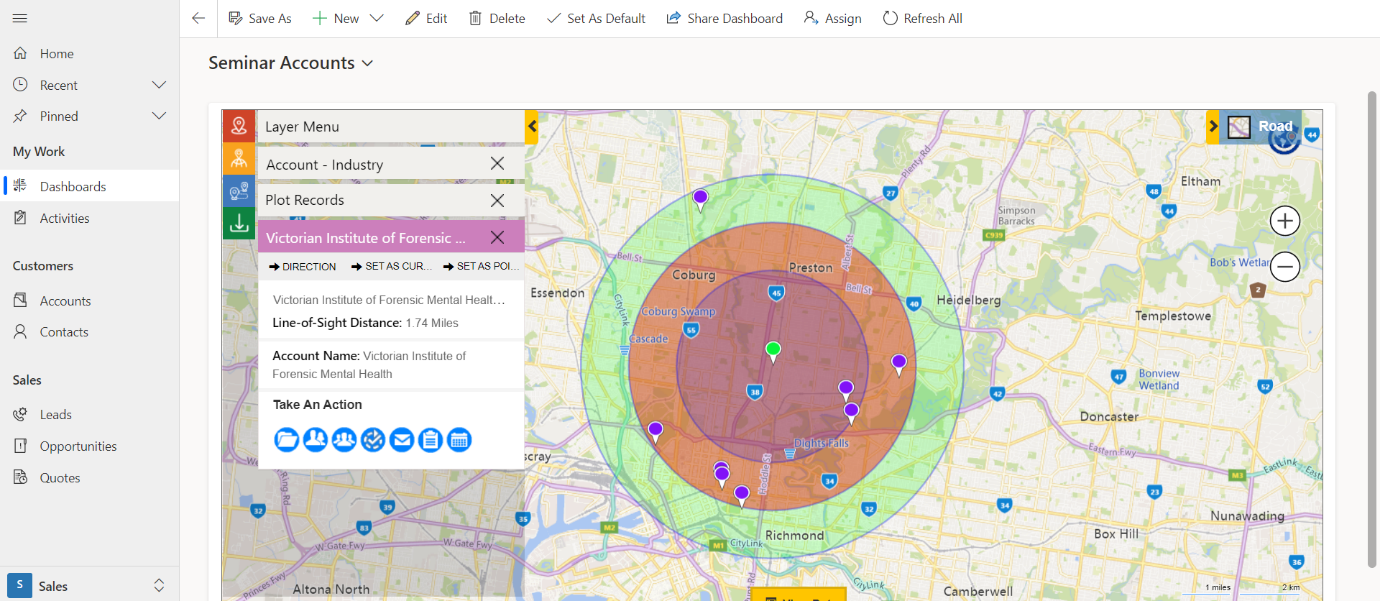
After clicking on OK button, the user needs to click on ‘done’ button on the CRM page. Thereafter, the user can open the saved template from the dashboard, he can also click on the pushpin of a record to view its tooltip card.
In this way, John can perform his business activities from the CRM page itself by adding template in dashboard, besides he can take actions related with a record in a single click and save his time. Overall, this enhancement will help the users to significantly improve CRM data visualization experience and enhance their data analysis. Sales team can also add templates in dashboard to review and improve their to-do list on a regular basis.
To know more about the new features of our latest release like Real-time tracking, Multi-search in PCF, Multi-Address Plotting, you can read our blog- Jan 2022 release.
Download Maplytics for a free trial of 15 days from our website or Microsoft Appsource to experience Maplytics for your mapping needs. For a live demo of the new features, feel free to drop us a mail at crm@inogic.com

