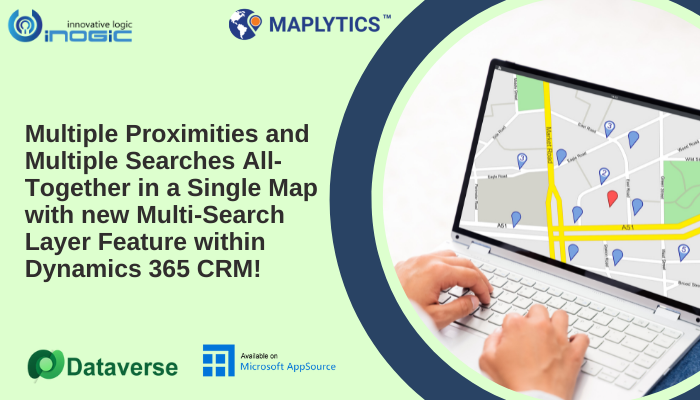
Visualizing Dynamics CRM data on a map is a great asset that helps CRM users in understanding their data geographically with ease. Maplytics is the preferred app for such use cases. With Maplytics, a user can plot their multiple entity records with color-coded pushpins to help users visualize their pushpins with geographical insights. Users can further perform features like proximity search, by drawing, by regions, etc. to view data more relevant to their interest. However, things can be difficult if a user needs to analyze their data with Maplytics features at the different locations all together at once. In the latest January 2022 release, Maplytics now provides the feature of Multi-search layers that will allow the users to perform multiple features over their CRM data that too at different locations together at once on the same map. Let’s understand this feature with a use case.
Stacy is the Sales Manager of the new branch of her company that recently opened and she has gained some customers in the last few months. She has a sales team that meets the clients and sells their products & cross-sells their other products. To make strategies to achieve her sales target, she needs to understand several factors like how much area their sales team is handling, how many clients her sales team would be able to meet in a day, or how much revenue they have made until now, etc. To do this, she uses the PCF control in Maplytics to visualize her dynamics CRM records on the map. She adds the PCF – Detail Map Control to her accounts entity using the steps from the help files. The below screenshot shows that the respective view has already been plotted on the map by default.

She wants to visualize accounts handled by 3 of her salespeople. To do this, she now uses the option of ‘By region’ to plot two of the postal codes where two of her salespeople reside. She is now able to see the Accounts from both of the postal codes plotted on the map.

For the third salesperson, she needs to draw a shape on the map that will cover a few postcodes together that her salesperson handles. To do this, she clicks on the “+” button to add a layer of New search. So this is a new search layer in which she now uses the option of “By drawing” and the freehand drawing tool to draw the required shape on the map. As the customers in her CRM are from different industries, she uses the attribute “Industry’’ as a category to color code the pushpins based on various industries. She is now able to see the Accounts from the various industries plotted with color-coded pushpins on the map.

She realizes that she hasn’t selected the category for the data plotted within the two postal codes earlier. So she selects the search 1 and adds the category ‘industry’ to it and clicks on search. She is now able to see the data within the regions handled by the three salespeople plotted on the map along with the color coding based on the industries they fall into.

Even though she went back to search 1 to add a category “Industry” to it, the resultant records from search 2 are still visible on the map. She can also click on any of the regions to view the summary card for the records existing in those regions.

She now wants to see all of the data that her salespeople would see if they perform a proximity search in their locations to search for the nearby records while they are planning a route for themselves. So, she clicks on the “+” button again to add a new layer to perform proximity search into region one. She right clicks on the required location within the postal code 1 to select it as the current location, enters three radii, and selects Industry to be the category to perform the proximity search with category. She is now able to view the data falling into the nearby area from the selected location into the postal code 1.

She can also click on any of the three circles plotted on the map to view the summary of the records falling into the circles and she is able to understand how many records the sales rep in that region will find nearby while planning a route for himself.

Likewise, she adds two more layers of proximity searches to find the nearby records from the locations within the other two regions. Now she is able to see the accounts falling into the nearby regions from the locations into all of three regions handled by the three of her sales people.

Now, even if she wants to go back and view the data into the three regions without any proximity searches, she can open the layer menu that shows 5 layers plotted on the map. She can easily use the toggle button for the individual search layers to show/hide the same. She can also use the toggle button to show/hide the sub-layers within each search layer. Here she uses the toggle button for search layers 3, 4, and 5 to hide the proximity search layers.

This makes it easier for her to view the data from each of the regions handled by the salespeople and further analyze the same as well. She is further able to compare the data for each of the salesperson she has in her team at different locations along with performing various features on the same together at once into the same map. She is also able to toggle between the search layers and cluster the data if huge data set is plotted on the map.
Download the latest Maplytics solution from our website and activate a free trial to test the latest features of Maplytics. Visit our blog to go through the latest feature from Maplytics release January 2022. Contact us at crm@inogic.com for a free demo of Maplytics, based on your mapping requirements.


