Maplytics Jan 2022 release introduces new features for PCF control enhancements, live tracking using Maplytics App (Android & iOS), and some enhancements into core Maplytics detail map. In this blog, we will see one of the Jan 2022 release feature i.e. multiple address support for an entity.
Let’s see the magic of this feature with an example. Rob is the admin in one of the organizations and they have large number of accounts to schedule a meeting but the problem is some of them have shipping address information and some have billing address information. Apart from this, there are few accounts that do not have an account location information but they have potential customer and that customer location is used as the location for an account. So, Rob faces difficulty to plan a route when he is having shipping location or billing location or it can be a potential customer location.
He can overcome this challenge using the Multiple Address visualization feature of Maplytics. At first, let’s see how to define Multiple addresses for an entity. First, you need to define address attributes into an entity map for an entity by following these steps:
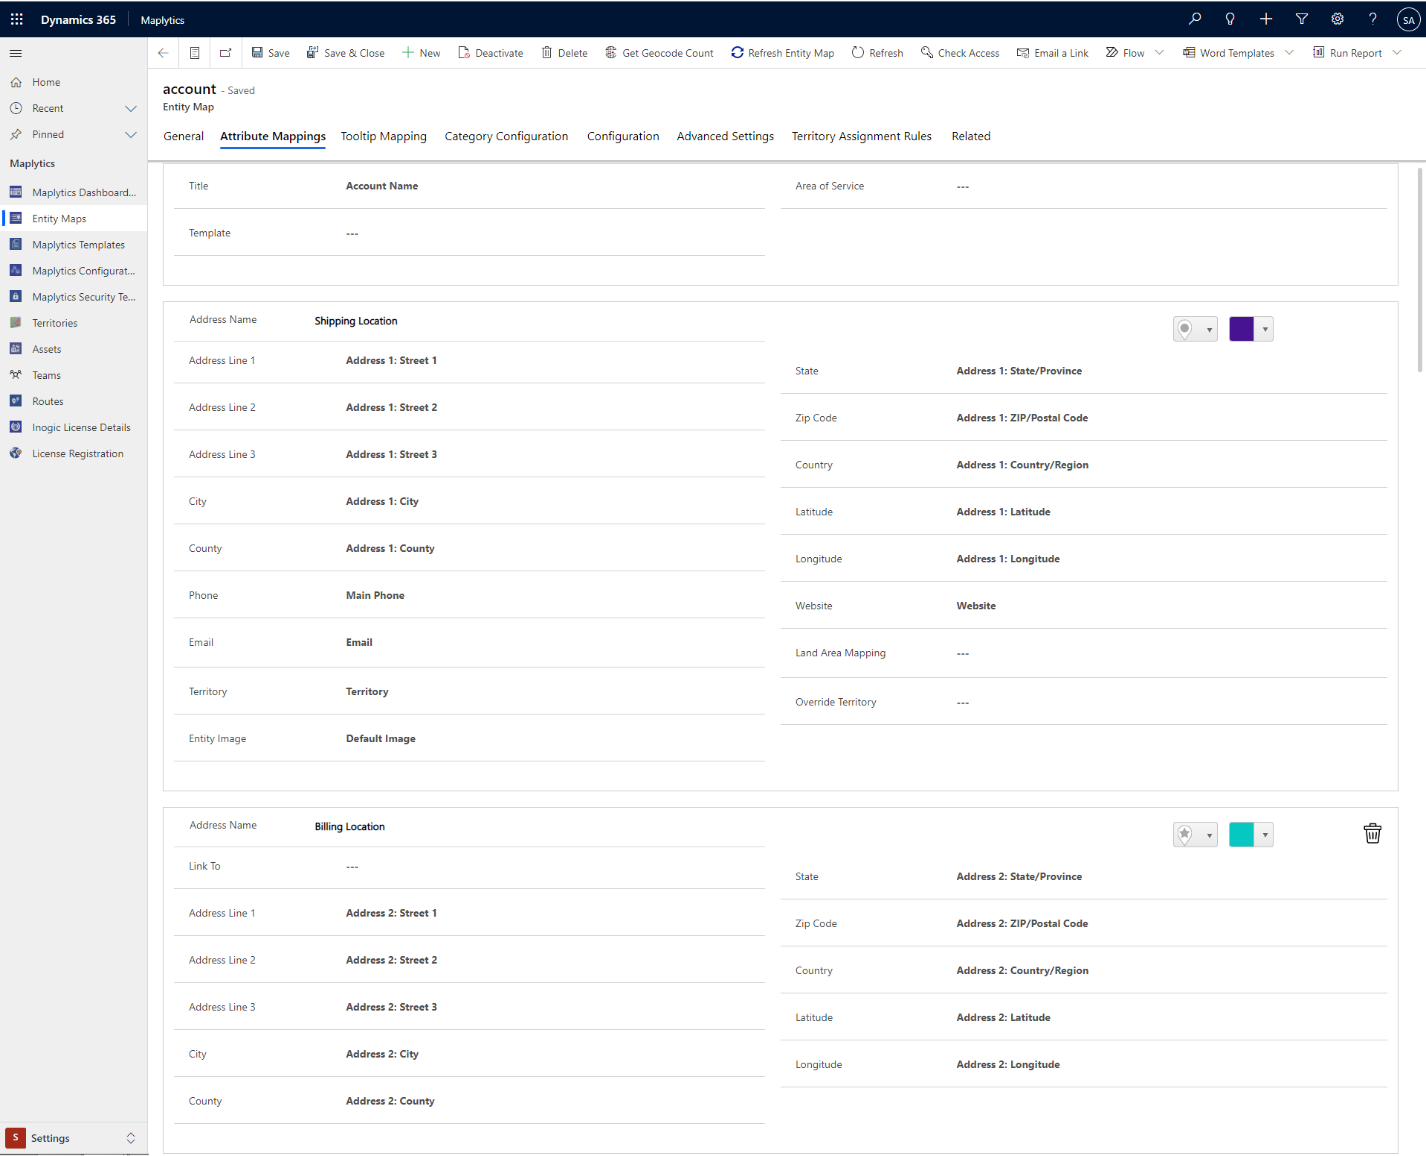
Maplytics Apps > Settings > Entity Maps > open Account Entity Map Record > select Attribute Mapping tab > click on Add New address
By clicking on add new address button, Address Name, the pushpin and color picker will be shown to define for each address section. The same address name will be shown on the plot card so that the user can select which address they want to plot and assign pushpin and color for different address.
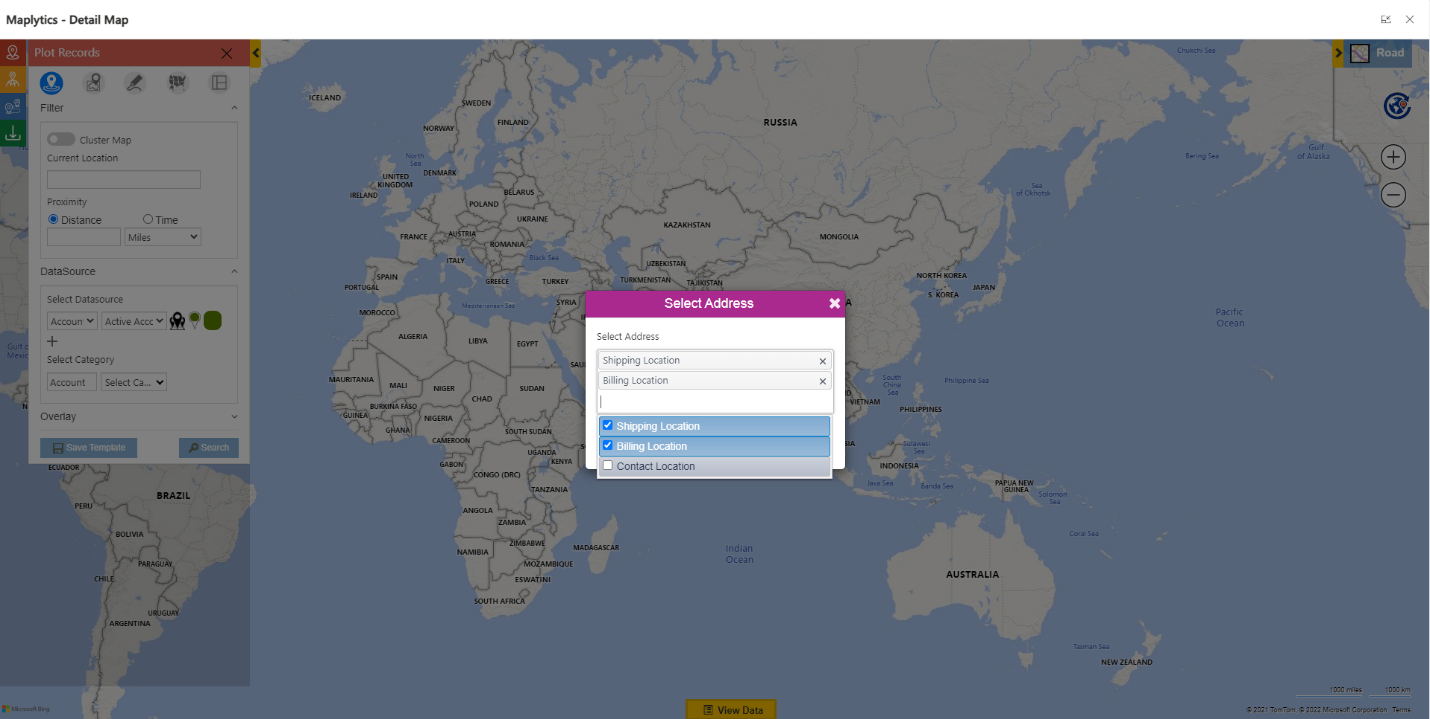
As Rob is done with the configuration part, now he will open the detail map which allows to select different addresses for each record as shown below.
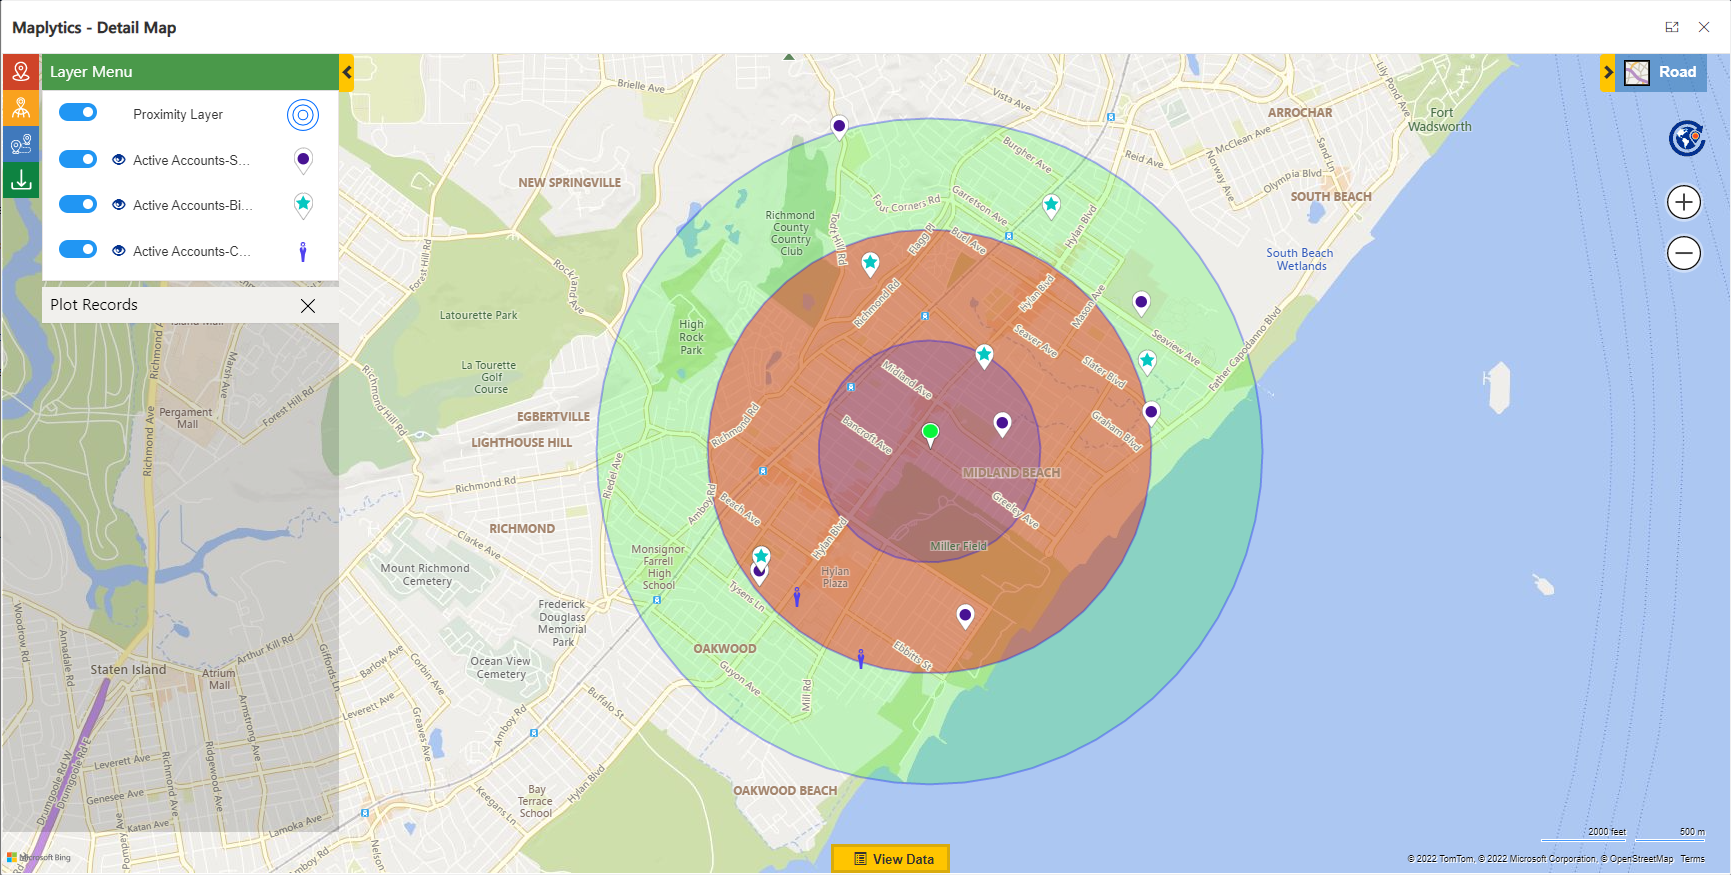
Here, Rob will be able to see all records that come within the proximity with shipping address, billing address and an address of contact location as well. Moreover, a user can define a maximum of four different addresses.
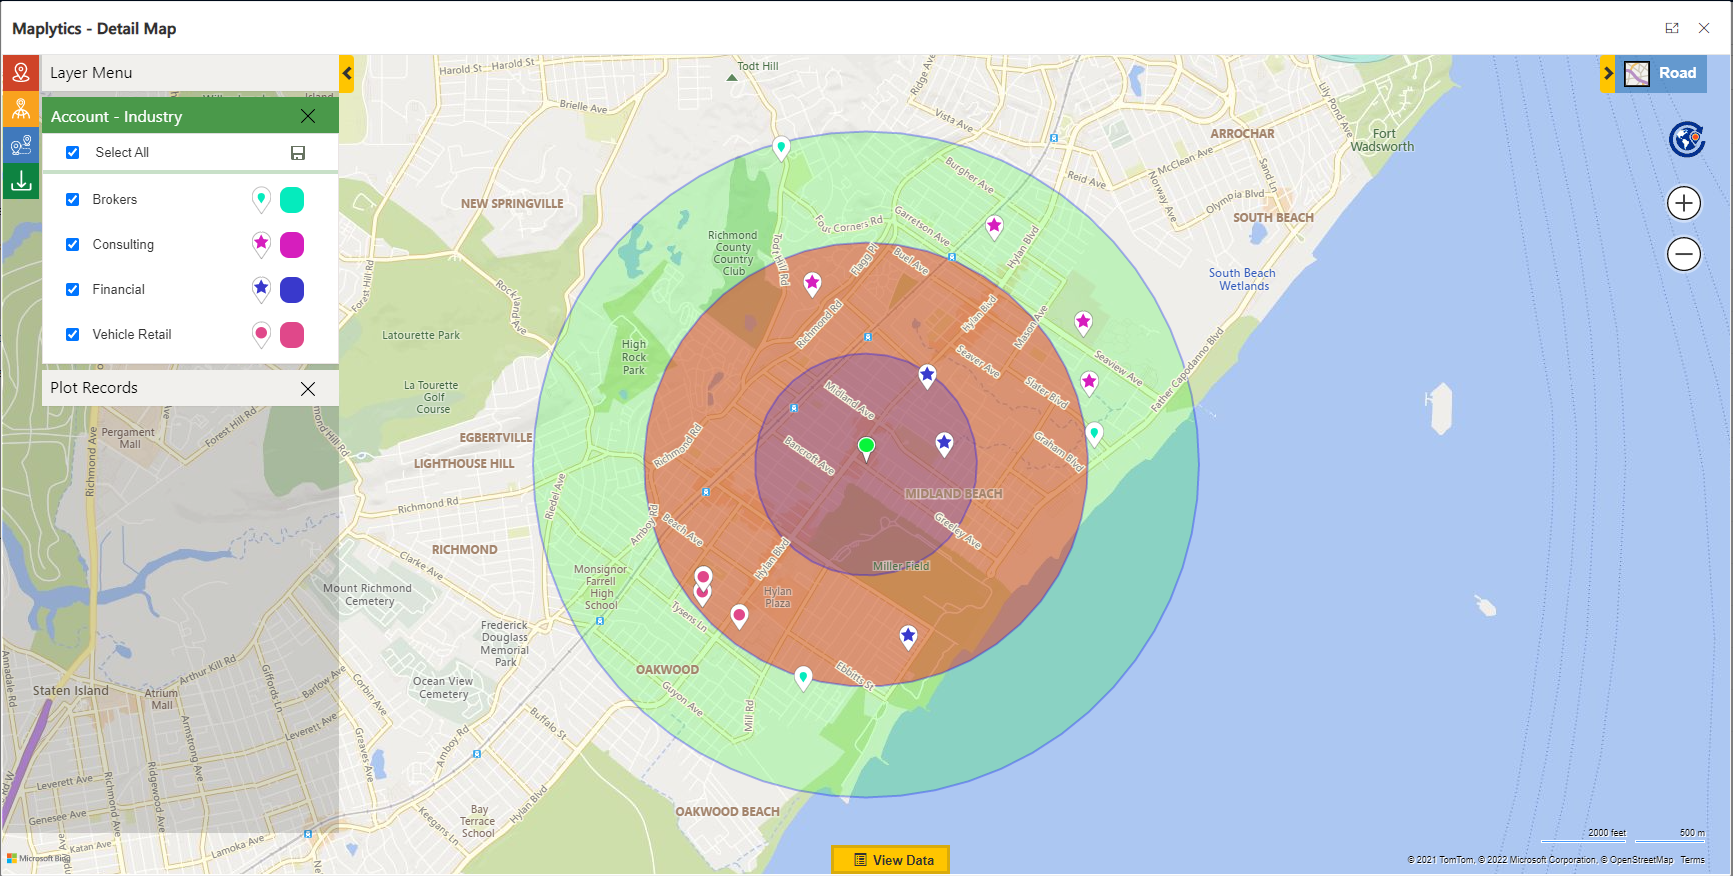
If Rob wants to visualize all this data into categories, it is also supported in multiple address plotting. The result is shown in a different color based on address name. Here Rob can select the category as industry and all the records based on industry type will be plotted on map as shown below.
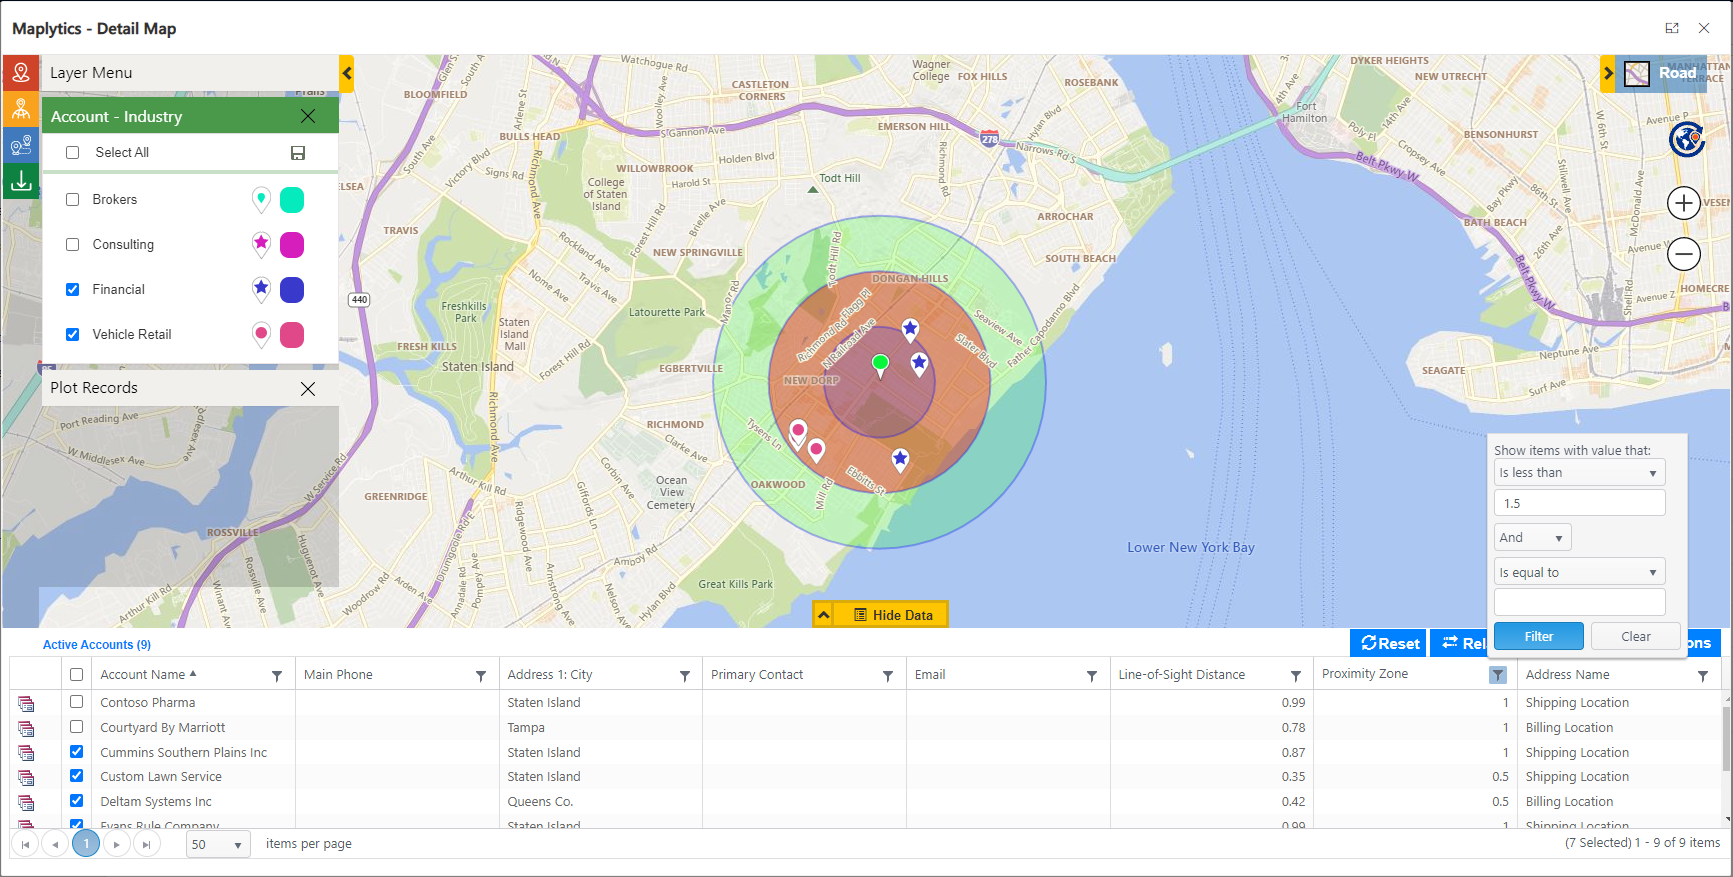
Also, Rob can filter the data using a category card or apply a filter on the grid.
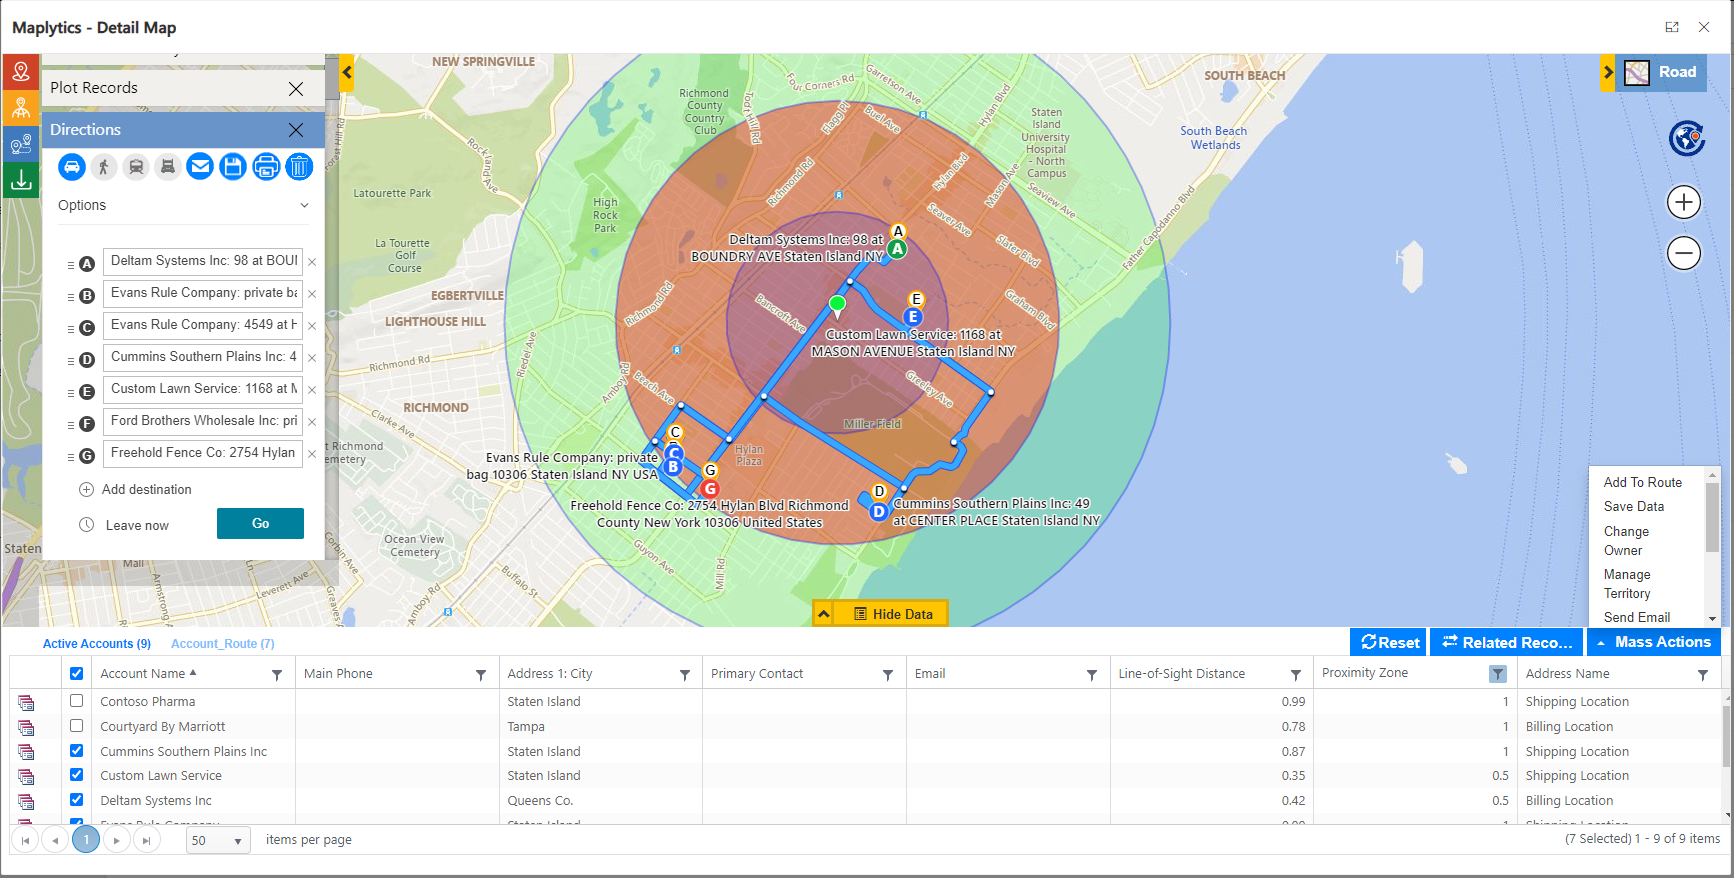
Now as Rob can visualize his required data on map; using mass action he can add them into a route or create an activity or send an email.
In this way, Multi-address plotting feature of Maplytics can be used to plot records with multiple addresses and thereafter perform business activities. Click here Maplytics Jan 2022 release for a complete overview of our Jan 2022 release features.
Start with your free trial today to see how Maplytics within Dynamics 365 CRM will cater to all your Location Intelligence needs. Feel free to email us on crm@inogic.com for a free customized demo of Maplytics based on your mapping requirements.

