While brainstorming and adding new features we have always focussed on improving our existing features as well. One of the most used search options we have is ‘By Drawing’. This option helps the user to visualize Dynamics CRM records within a region on the map which does not have any specified geographical boundaries. User can draw a shape to cover the required region and search to visualize the records that lie within that. With increased usage of the same, we have tried to make this option a bit more advanced by redesigning the drawing toolbar and adding more options to get the desired results.
Let’s have a look at the newly designed drawing toolbar. Drawing toolbar now has many tools to draw the desired shape on map. This helps the user to plot and filter data by defining their own shapes.
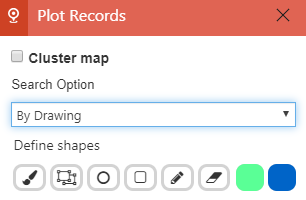
Users can use ‘Drawing toolbar’ to draw the following shapes:
- Freehand drawing
 – Use this to draw a shape of your own.
 - Polygon
 – User can draw a polygon of the desired size with ‘n’ number of sides.
 - Circle
 – Draw a circle of the desired size.
 - Rectangle
 – Draw a rectangle in the desired size.
Users can further edit the drawn shapes by using following options from Drawing toolbar:
- Edit
 – User can use this button to edit a drawn shape and resize it to required dimensions.
 - Erase – User can clear any drawn shapes from the map.
- Fill color
 – User can define a color to fill in within the selected drawn shape.
 - Stroke color
 – User can choose a color for the boundary of selected drawn shape.
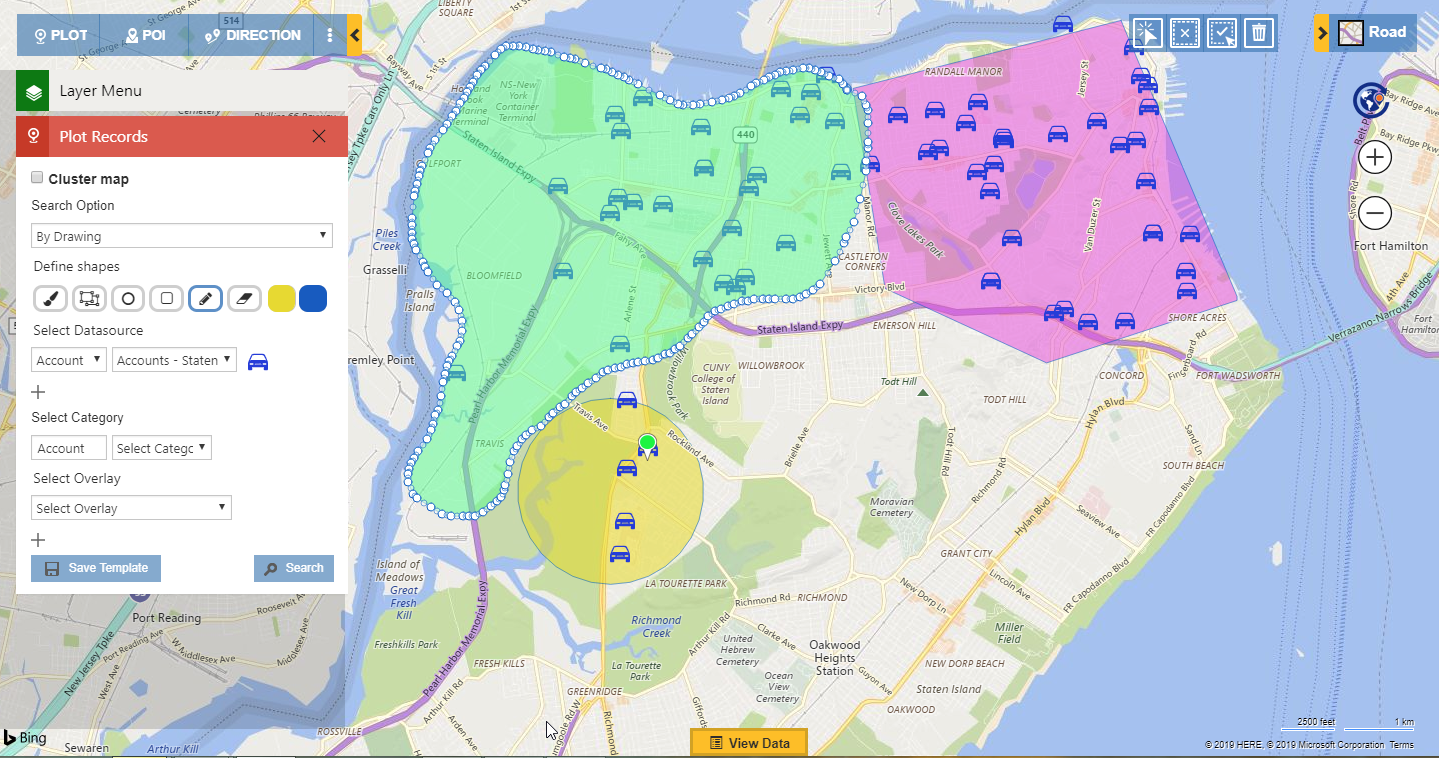
Multiple tools in drawing toolbar provide users the freedom to draw a shape exactly as required on the map and search for all records that lie within the drawn shape. Users can draw multiple shapes on the map to cover the required region and search for all the records within.
Along with visualizing the records within the drawn shapes, users can also use the search option ‘By drawing’ to perform binary operations on the drawn shapes as well as create territories with the selected drawn shapes. And those sweet little pushpins of your choice makes it more visually smart.
Try out the plot card to visualize your Dynamics 365 CRM records with different search options. Install Maplytics directly for v9.x on Appsource. Contact us at crm@inogic.com for a demonstration of Maplytics – your favorite Maps integration solution for Dynamics 365 CRM and PowerApps.


