Sometimes it becomes difficult to search your desired Dynamics CRM data on the basis of region or geography. For example, finding Dynamics 365 records that don’t share common fields would be difficult to find with Field filtering/Advanced Find. Proximity search works well in most of the cases when you need to find records within the range of ‘x’ radius of a particular location. But in some situations, a circle is not the right shape to find records. In those scenarios, plotting Dynamics CRM data by drawing a shape on the map can be helpful to get ideal results.
Maplytics offers many different ways to plot, search, and filter data on a map for better visualization of Dynamics CRM data. ‘By Drawing’ search option provides the ability to draw different shapes like N-sided Polygons (freehand drawing) and plots data within enclosed boundaries of the shape drawn. Users can further use category or filter option to manage data in a more organized way.
How to go about Drawing Shape on Map:
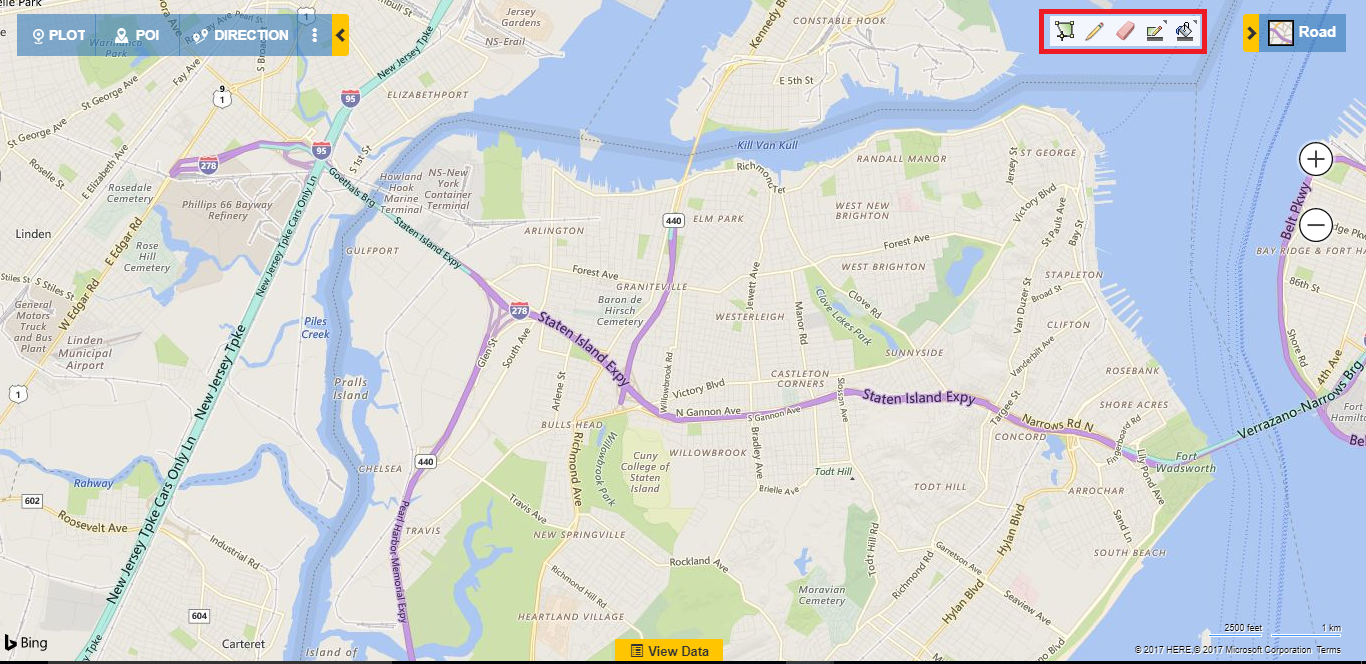
- Go to Detail Map > Use ‘Drawing Toolbar’ to draw any shape as shown below:
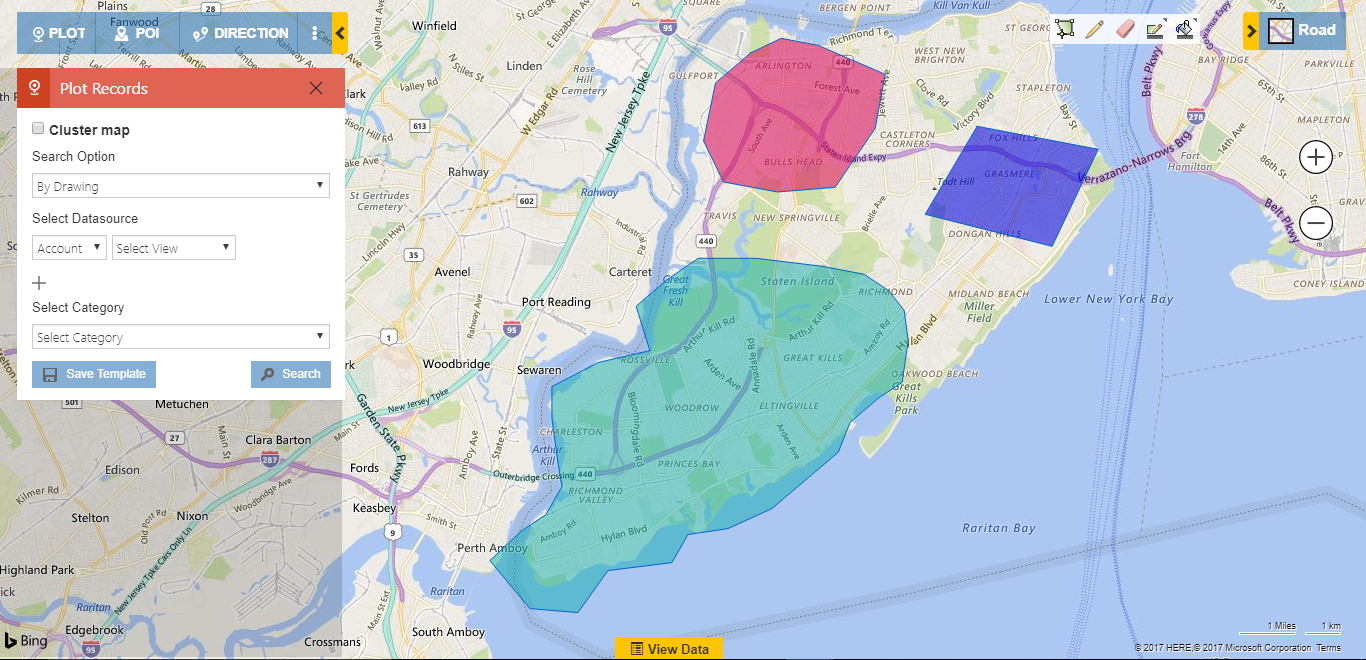
Below is a sample image of different plotted shapes on the map:
- The user can further edit these shapes from other functionalities as discussed below:
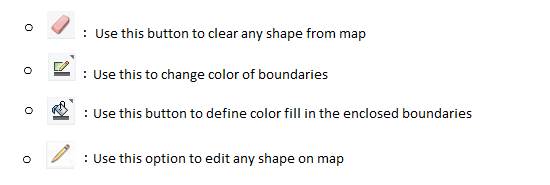
Apart from plotting data in these shapes, the user can use following different options to reach out to a focus area.
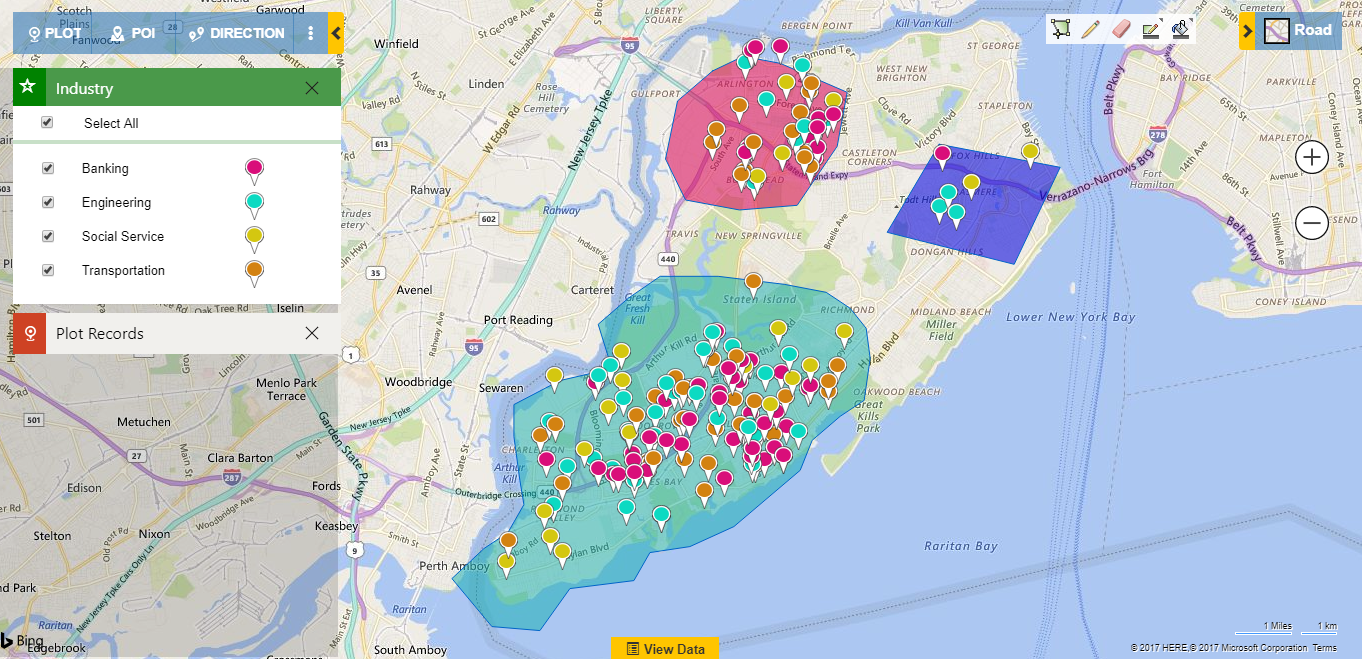
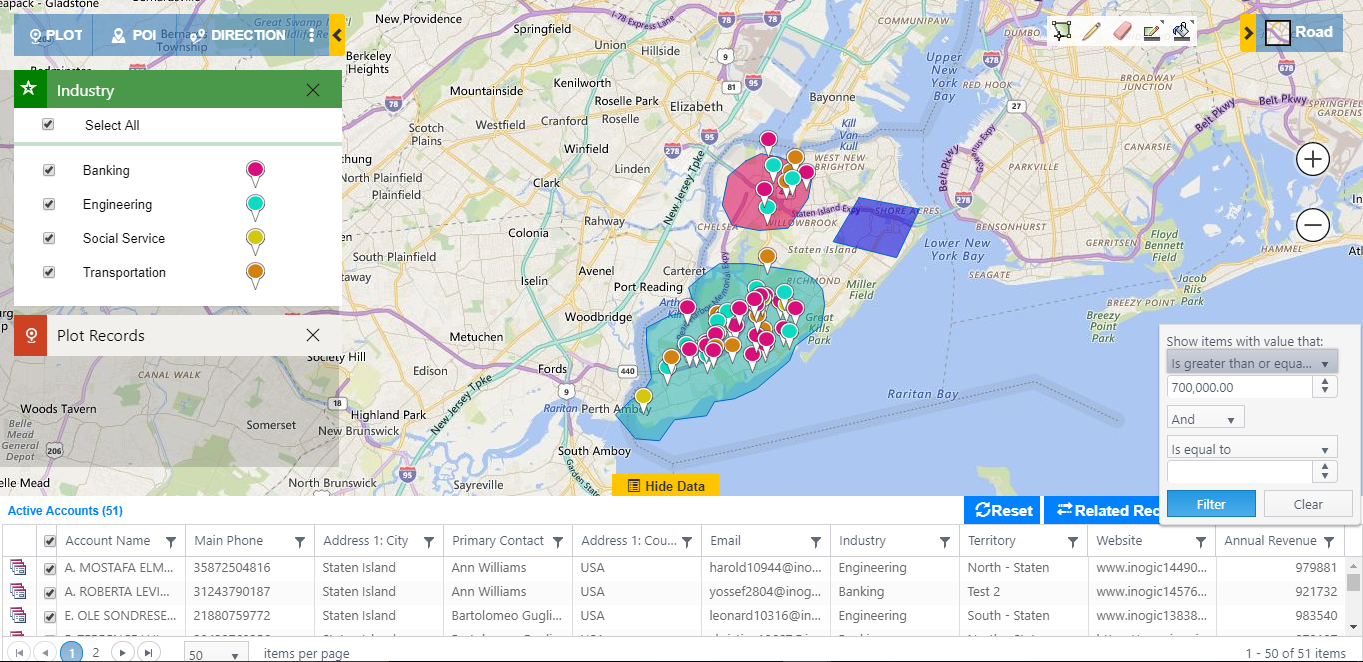
- Category: Use this option to color code markers on the basis of entity field on the map as shown below:
- Data Grid: User can further filter data on the basis of columns selected in a particular view or one can de-select any particular data points from the map as shown below:
- Mass Action Button: User can take actions on the selected data points in data grid like Change Owner; Save Data as personal view or build a marketing list for plotted data points in Dynamics CRM.
Conclusion:
This blog will give you a walkthrough for one of the Maplytics functionalities, i.e., “By Drawing” search option. There can be different needs where the user wants to plot Dynamics CRM records in the specific area of the map. Drawing different shapes on a map using Maplytics can help you to plot Dynamics CRM data within that particular shape and help you plan in a much better way.


