“I said to myself it is my new job and I can’t be complaining, and I kept going. I pushed through the overgrown weed but my car finally gave way! My wheels got stuck in a swamp. Thank God for those lovely farmer folks and their families. They took me to safety and recovered my stuck car”, Ana ended with a shudder and relief. She was an efficient field sales rep who had been summoned to meet a new lead at the city outskirts. Unfortunately, the haphazard directions landed her on farmland and she had quite an adventure. The lead location was apparently, wrongly marked and there was no foolproof method with her organization to verify it beforehand.
While Ana like her namesake was basking in her adventure and talking about it to anybody who even remotely appeared interested, my mind had long crossed the bushes, the farmlands, the barriers, and was secretly appreciating the use of land area mapping opted by my forward-thinking company within Microsoft Dynamics 365 CRM. Just like Ana, I too was a celebrated field sales rep working for a prestigious cosmetics brand. I too was responsible to set up meetings with potential leads, try and onboard them, visiting them for services afterward, and so on. But my employer had made it all easier for me by licensing Maplytics, the popular geo-mapping app of the Microsoft AppSource.
Maplytics has a number of features and we rep use almost all of those for seamless operations. Our managers and the top management also utilize some unique offerings for their analysis and use. I personally am a fan of the fact that my sales territory is well-demarcated for me. No colleague of mine cannibalizes my leads. We can all visualize our respective leads on the maps.
My manager, Hannah, creates my appointment schedules for me, weeks in advance with the Auto Scheduling feature and also plots optimized travel routes for me to travel to these appointments with the Route Optimization option. I check in and out of the meetings on the go, share my notes and attachments on the go, and can access the app on my phone, tablet, laptop, or desktop, easily. I have been appreciating all these features for years now. But Ana’s adventure made me realize the value of Land Area Mapping.
You wanna know what it is? Let’s go!
When a lead is assigned to me, it is added to the territory I’m in charge of. While doing so, it is plotted on the map. The region it belongs to is checked. Whether the lead falls in a farmland, a residential area, a downtown commercial or an office region can all be viewed. Hence, situations like Ana’s are highly unlikely.
If a user works with lands, real estate or farms, etc. he can visualize the lands on the map with this feature. The User will be able to assign land regions to the records and visualize them on the map to understand the coverage of area for each of the records.
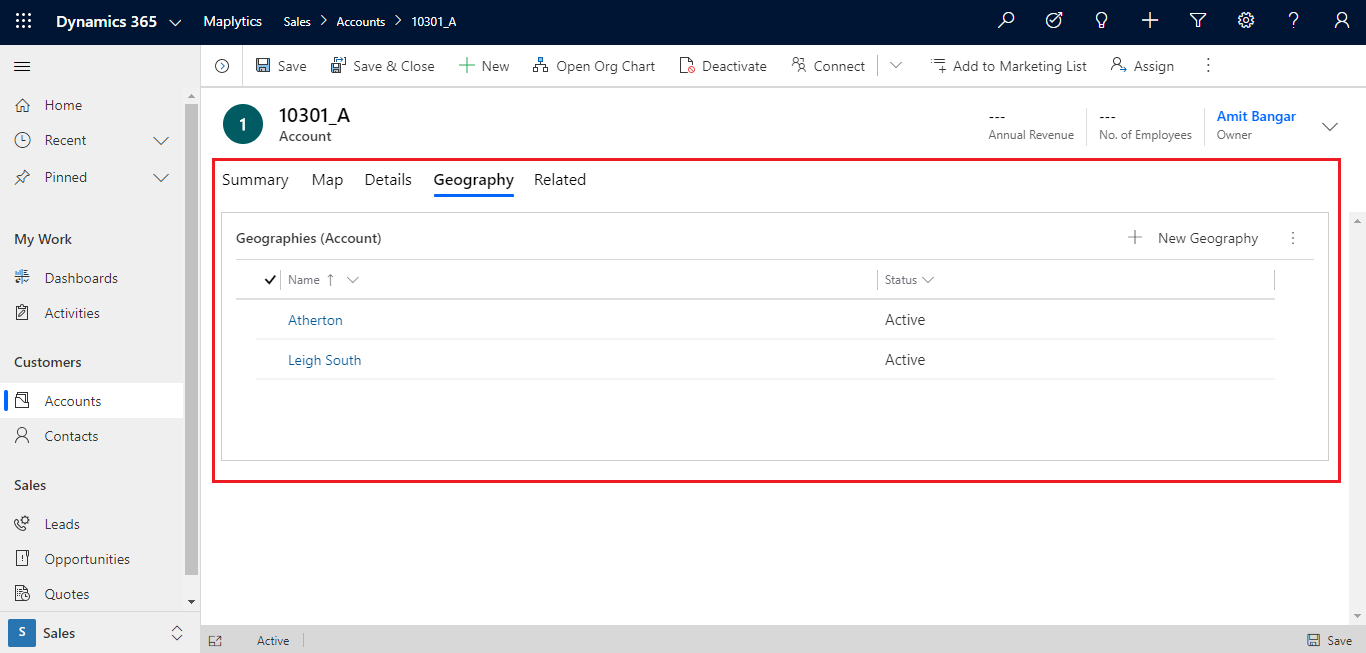
In case, the user wants to visualize the landscapes for Account records, he needs to create a 1: N relationship between the Accounts entity and the Geography entity. The User can also add a grid on the Accounts form in order to see the list of landscapes that have been assigned to the record.
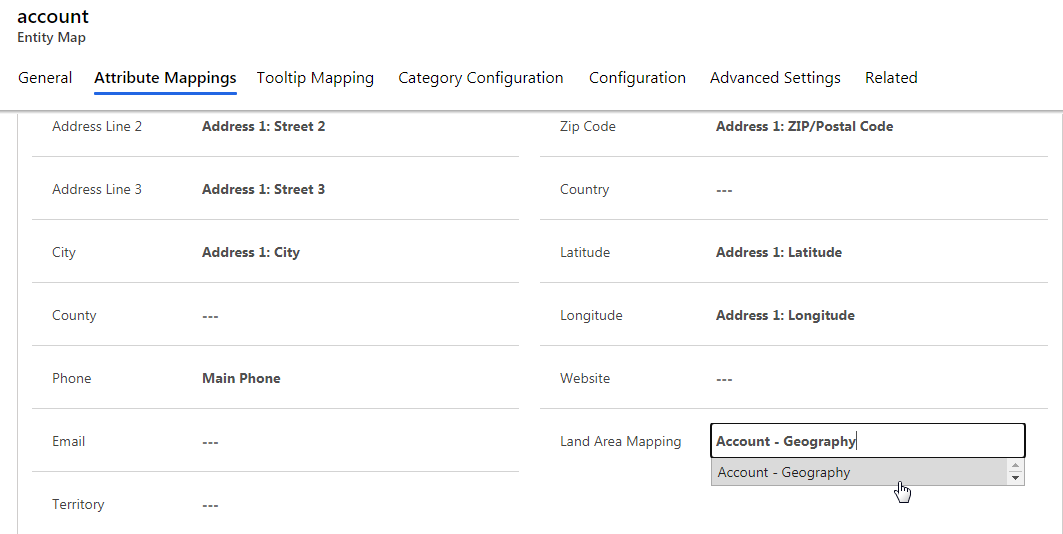
Once the 1:N relationship is created, the same is selected in the respective Entity map.
In order to visualize the land of a record, the user also needs to create the geography for the landscape and assign the geography to the respective record.
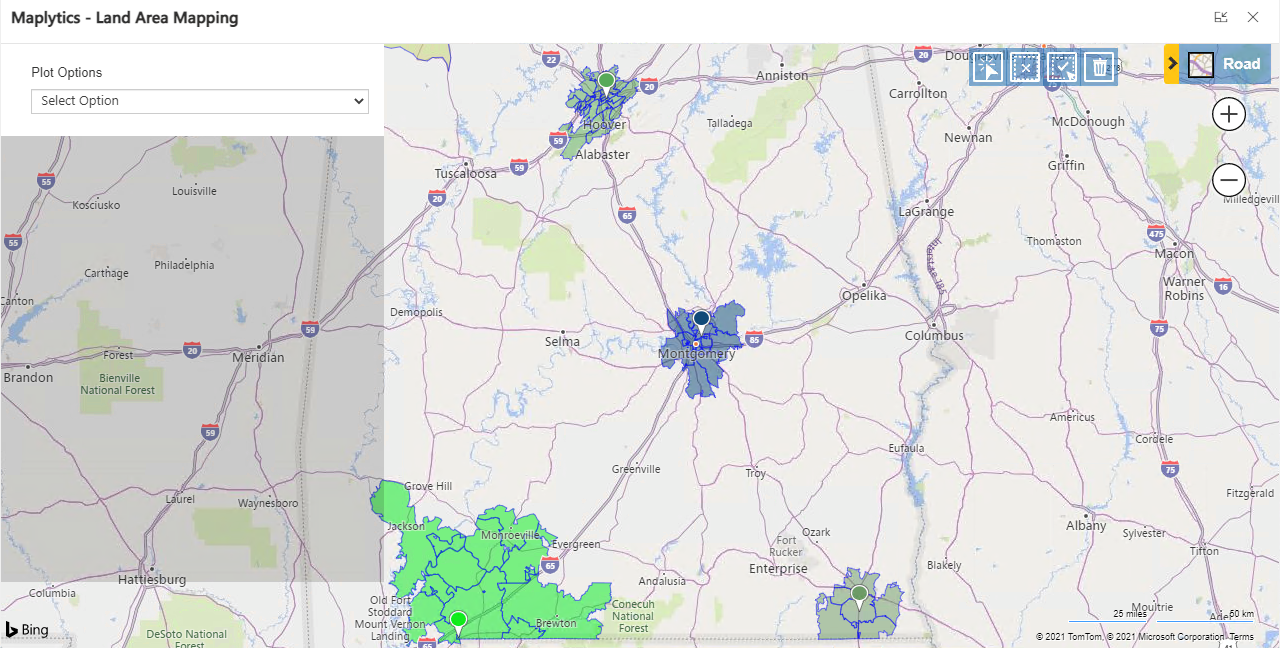
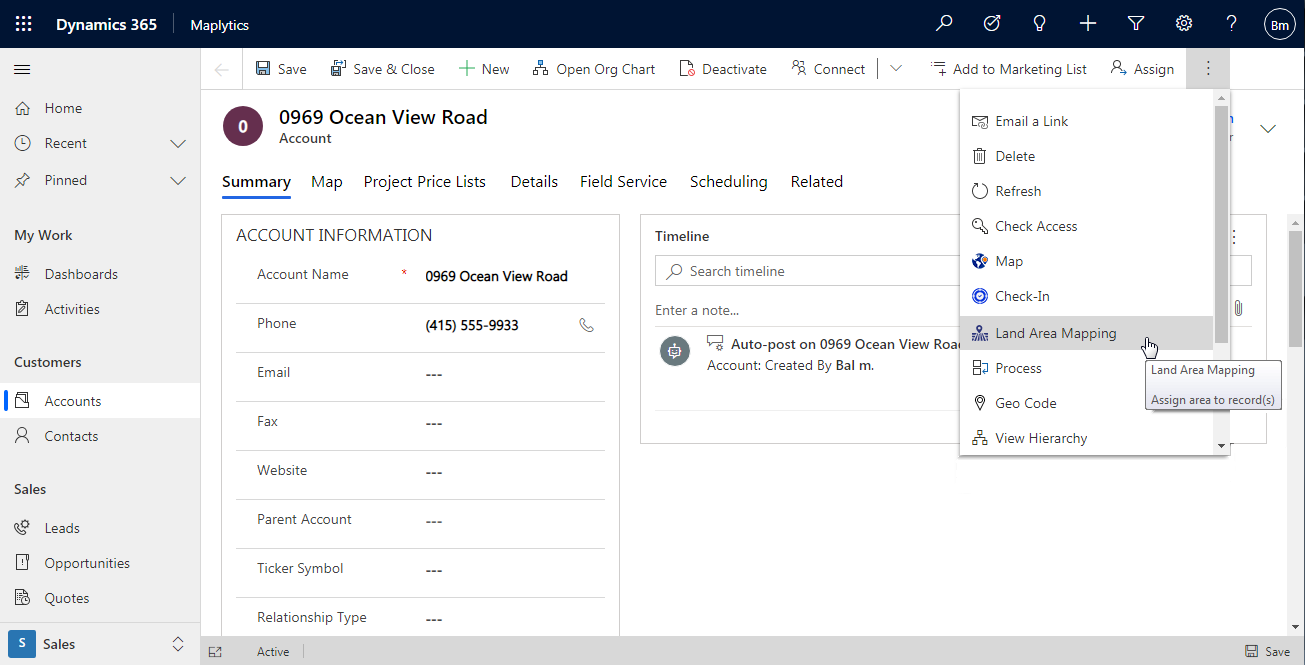
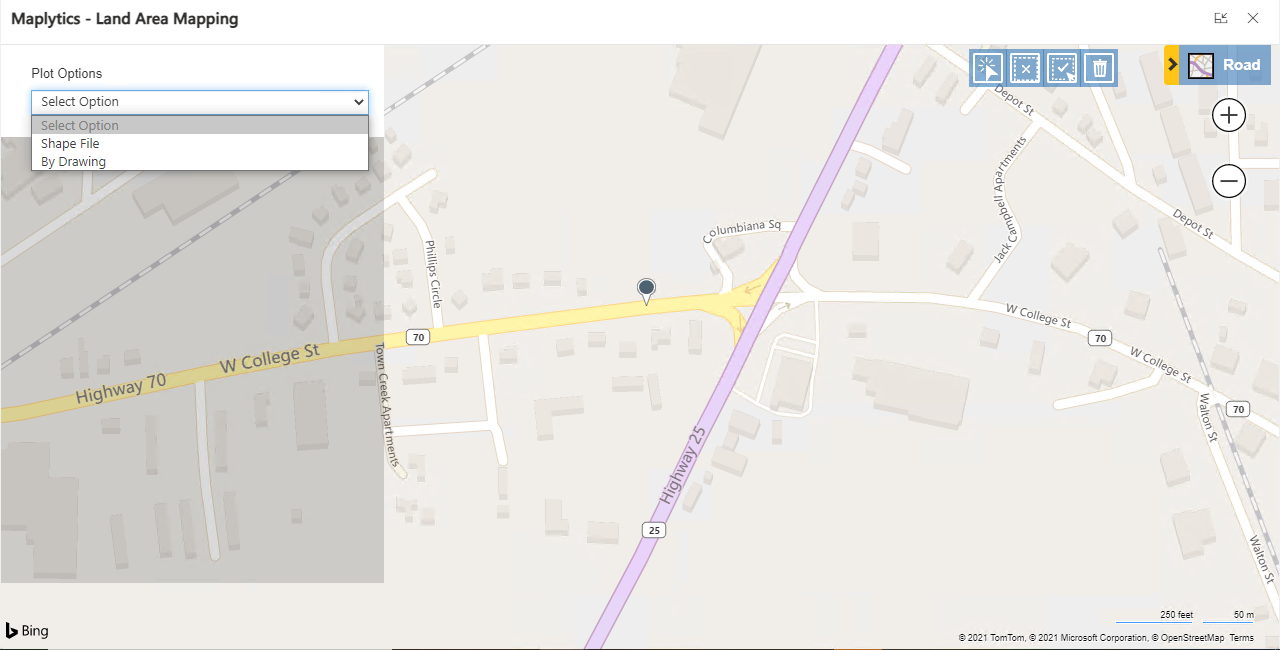
On clicking on ‘Land Area Mapping’, a new window opens where the user can upload Shape files or Excel files or draw shapes for the landscapes on the map.
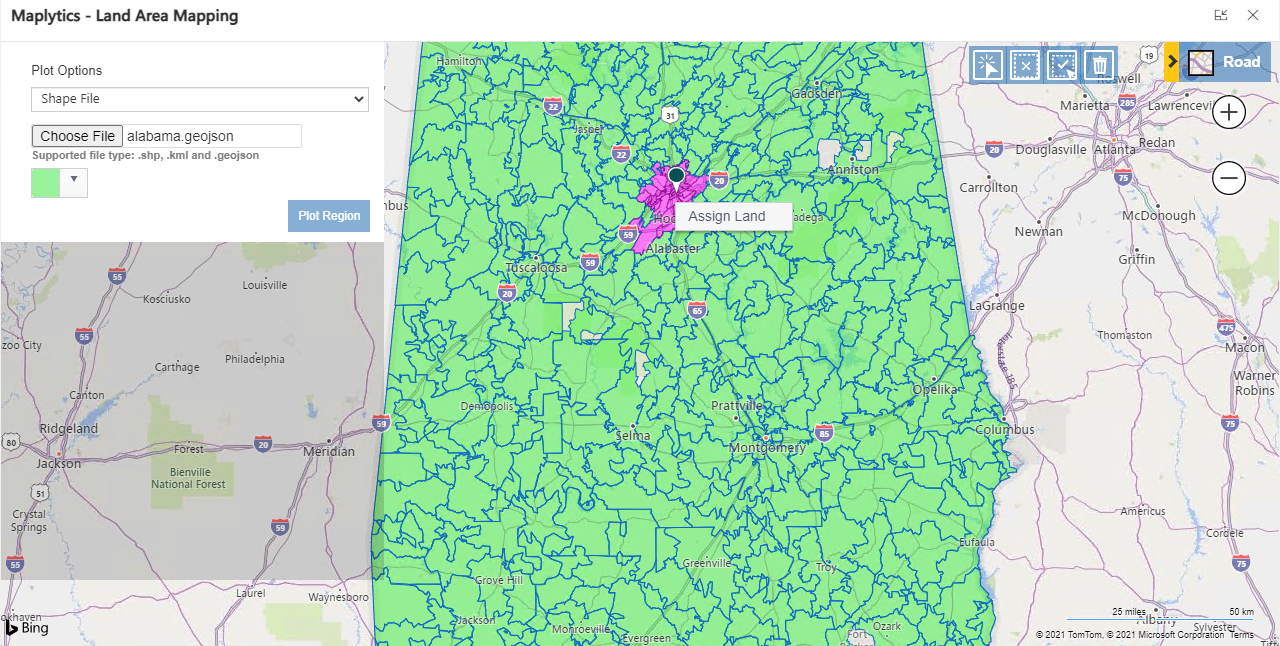
Shape File
Users can select a shape file or an excel file to plot the respective lands on the map. Once the file is plotted on the map, the user can use the selection tool at the right top corner to select, deselect, multi-select, or delete the regions plotted on the map. Now user can select the required regions and right-click to Assign Area.
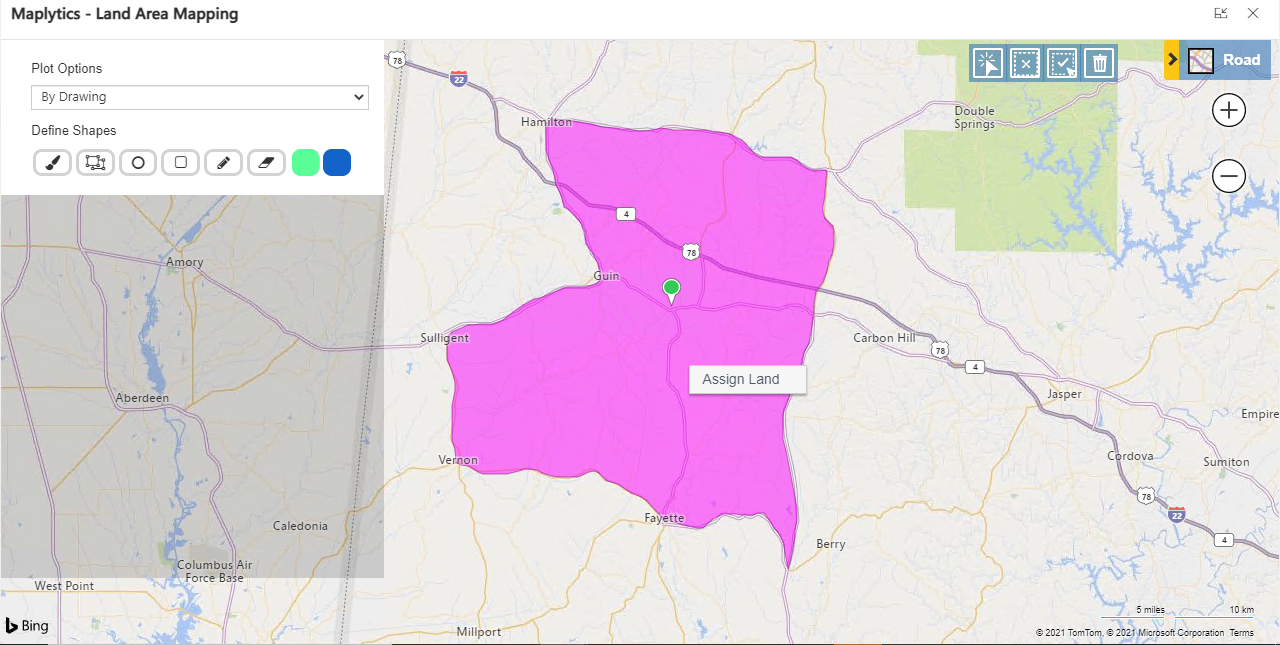
By Drawing
The user can also create geographies for the landscaping using the option of ‘By Drawing’. He can use the drawing tool to draw the shapes for the required landscape on the map. Further, use the selection tool to select the drawn shape(s) and right-click to assign an area.
How to view the assigned land?
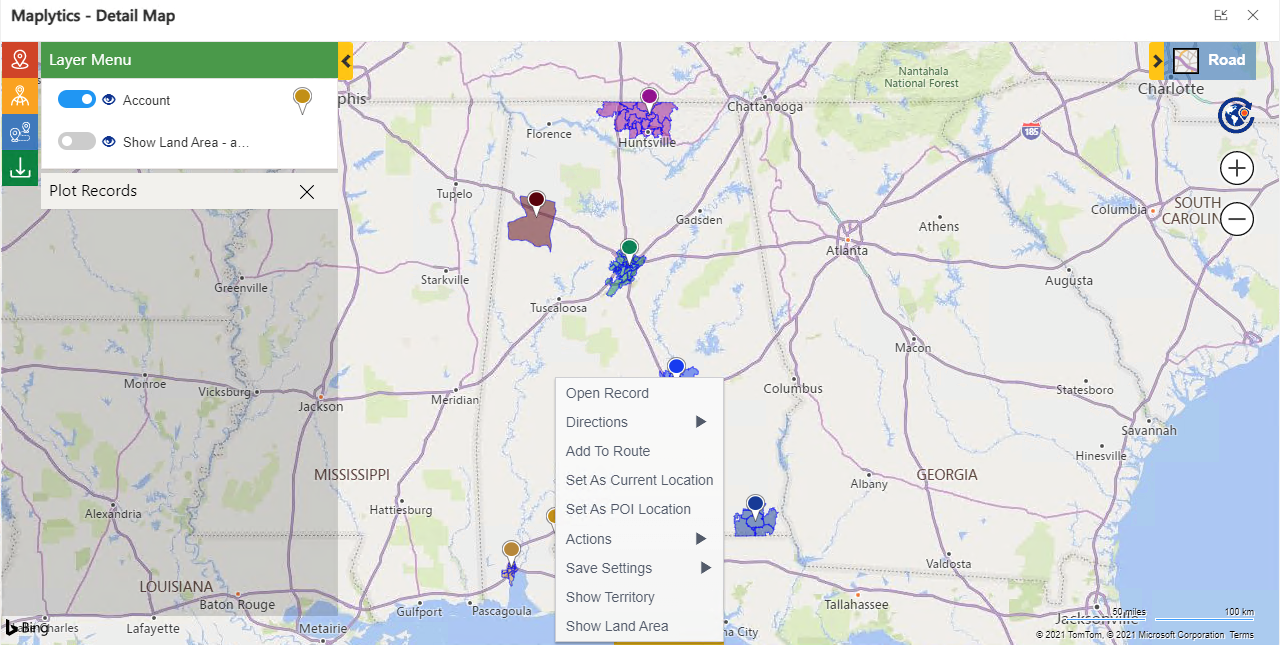
The user can select the entity in Datasource and the respective view in the ‘Plot Records’ card in Detail map to plot the record on the map as pushpins. While visualizing records on the Detail map, user can right-click on any pushpin to open the Contextual menu and use the ‘Show Land Area’ button to plot the land that is assigned to the respective record.
What are the benefits?
- Land Area Mapping helps prevent situations like Ana. The rep is aware of where he is going and is at a valid client
- Real Estate businesses can rate properties for sale based on the surrounding regions
- Financial institutions can lease offices in areas surrounded by residents or offices
- A tractor manufacturer can set up near farmlands or near a market land as per his business preference
- Farm producers can check out the water supply units before buying a piece of agricultural land
There is a lot more to Maplytics and Land Area Mapping. To get more acquainted with Maplytics and experience it further, write to us at crm@inogic.com. To explore the product in depth, with a free trial of 15 days, or a personalized demo within Microsoft Dynamics 365 CRM / Dataverse get in touch with us.
For applied knowledge, do visit our Website or the Microsoft AppSource. For a quick query resolution, you can hop on to our Blogs, Client Testimonials, and Video Library.
Until then,
Happy Land Mapping!

