To grow and expand any business there is a need to deeply understand its market and target audience. Once identified, the smart move is to streamline the necessary resources and efforts towards them. This process gives rise to a need for deep and meaningful analysis of your customer data.
Dynamics 365 CRM does a fantastic job at consolidating and managing your information in this respect and gets you closer to having more control. However, there are still many companies that still miss out on a very important piece of geographic information and analysis. This is where Maplytics steps in and offers exclusive locational intelligence.
Let us walk through a scenario to understand this better. Consider if you had a company called EduNow that sells a product used by school students in the USA. You need to maximize returns from your marketing efforts, so you need to target the right geographic location to run your lead generation campaigns.
EduNow targets the city of New York. Within the city, there are multiple postal code areas. EduNow needs to focus on the areas where below 15-year population is higher. This single targeting, if executed right, will increase the quality of your prospects and your leads will be almost sure to convert!
Let’s see how Maplytics would help you do this.
First, you need to get the excel data with all appropriate information. Once you have an excel file, follow the below steps to upload and configure the excel file:
Go to Settings -> Territory -> click on New -> give name and click on Save -> select Maplytics Territory Preview -> select Excel File option.
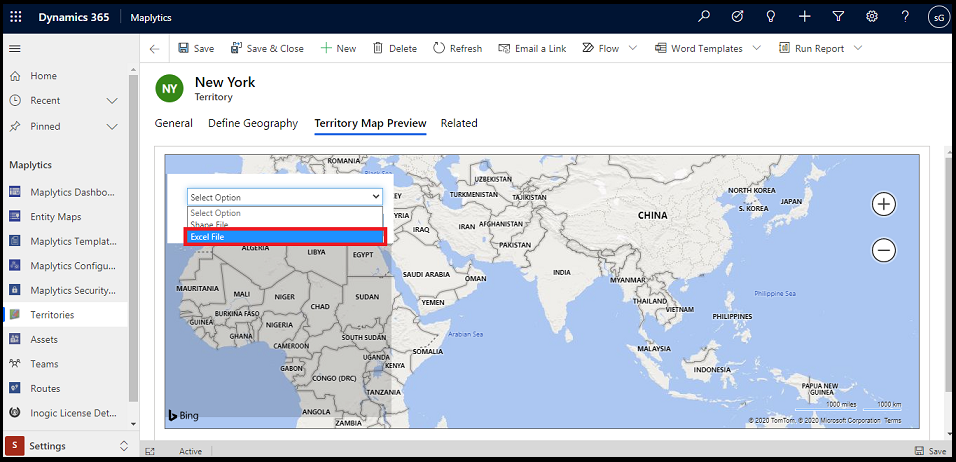
Note: The region column should be in Excel.
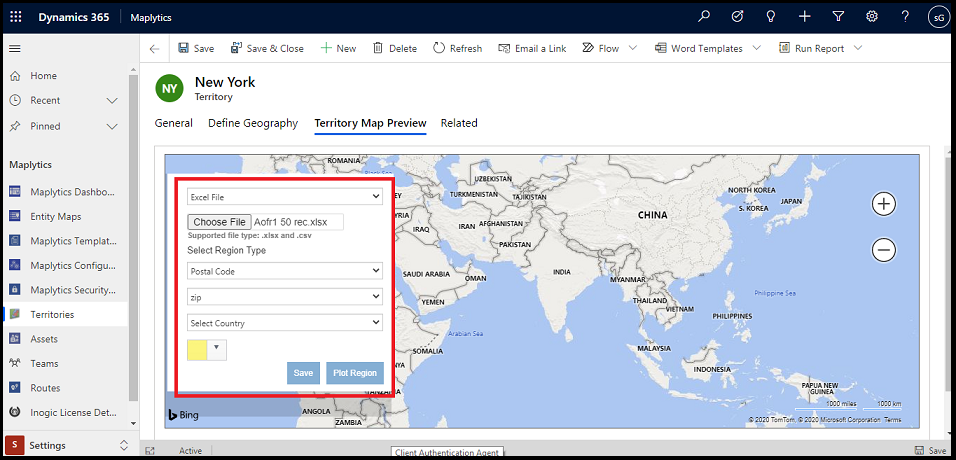
Once you browse the file, select the region column and color for the geography and click on the Plot Region. Once all-regions are plotted, click on Save.
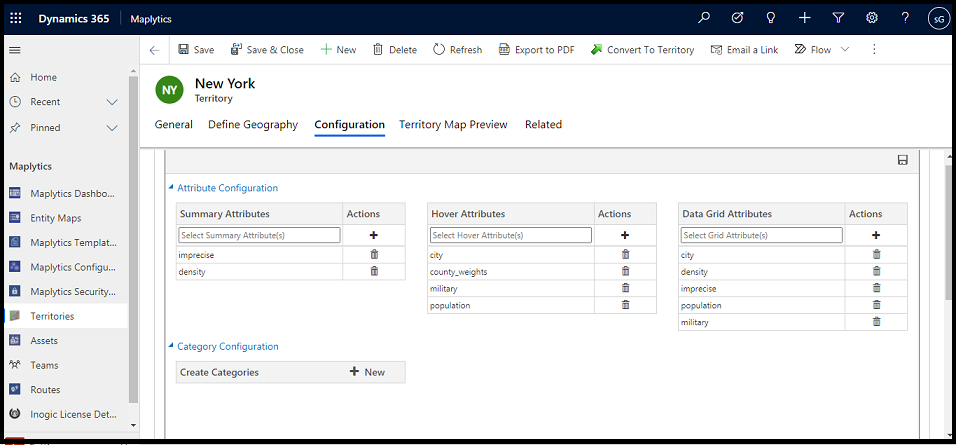
Once the required geographical area is created and plotted on the map then you can configure other attributes that you need to show. For example, you can set hover attributes, summary attributes, data grid information, etc. As you can see here, I have set some Excel columns which need to be shown on the map when a sales rep is on the field.
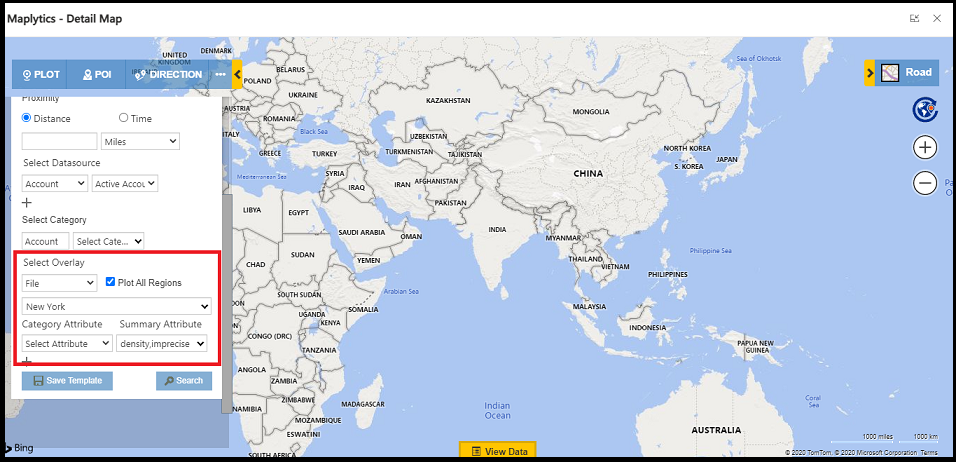
Now let’s see how it will show on the map. First, go to the Detail map’s ‘Select Overlay’ section and select the record which we have created. Once you select the overlay record, the column which we selected in the configuration tab will automatically get selected. Now click on search.
After plotting the overlay on the map, you can hover on the geographical areas to see more information or you can click on any shape, it will give you further summary attribute information in the Tooltip card. Also, you can see all the required data in the View Data grid as shown.
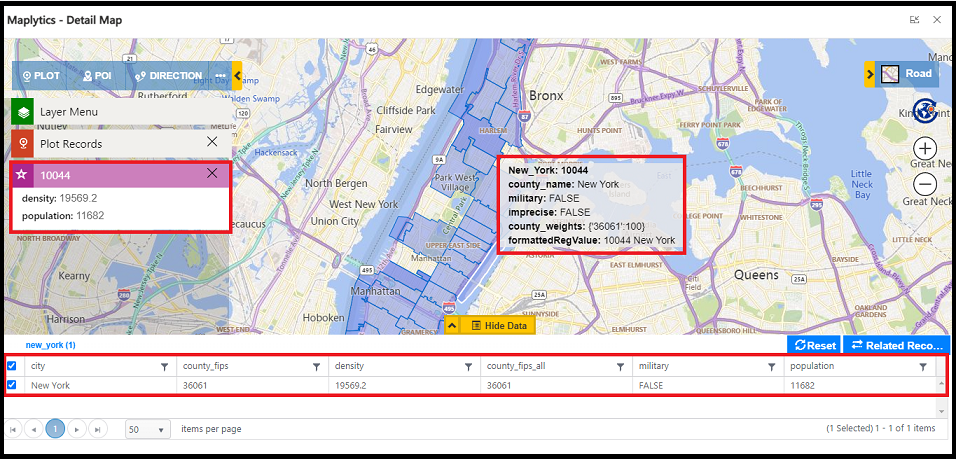
This was a simple glimpse into how your sales rep will get abundant information about their region boundaries like total population or density of the geographical area. Maplytics ensures that your sales reps can analyze, drill down, and gain insights for which area they should focus on to get more sales.
Got a couple of minutes? You can get a crash course into the power-packed features of Maplytics through this video:
So if you want to get the first-hand experience of this favorite mapping solution of the Dynamics community, you can head over to our website or Microsoft AppSource (we’re even recommended by Microsoft with a Preferred Solution Badge) to download a free 15-day trial. Likewise, if any feature catches your eye and you want to know how it will apply to your organization, you can get a free demo from our experts by simply dropping a mail to crm@inogic.com.
So until next time –start visualizing your success with Maplytics!


