The best way to analyze and perform drill-down analysis of your Dynamics CRM data is to visualize the data on a map. Maplytics is a locational intelligence tool that helps to view your CRM data on maps by bridging the gap between Dynamics 365 and Bing Maps.
In this blog, we will discuss how you can use Maplytics Entity maps to customize the view on maps to your preference.
What are Maplytics Entity Maps?
To plot the CRM data on the map and perform various geo-analytical actions, Maplytics needs to access the data in CRM and connect Dynamics 365 and Bing Maps for various map operations. And this is done through the Maplytics Entity maps.
So, if users want to plot any entity records on the map, it is required to have a Maplytics Entity map for that particular entity. Maplytics Entity maps not only acts as a bridge between CRM entities and Maplytics but also provides tons of options to customize how the data is represented on the map.
How to access the Maplytics Entity Maps?
Accessing the Maplytics Entity Maps is simple. Go to Settings > Maplytics > Entity Maps
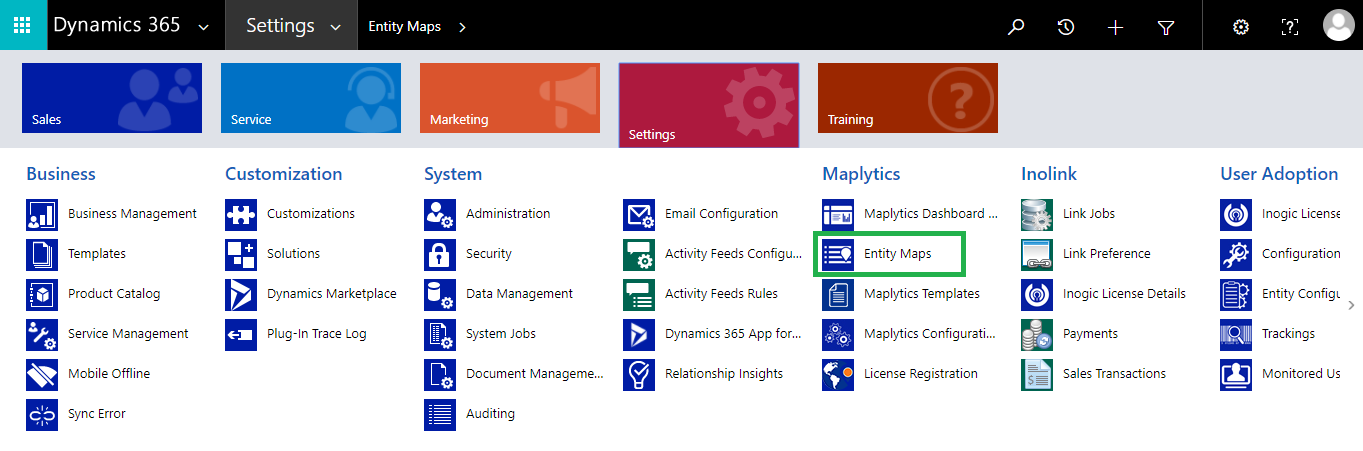
Here, you can edit the existing entity maps or create a new one for any Custom or OOB entity that can be associated with address attributes. Click ‘New’ to create a new Entity map.
Click here to know how to create Maplytics Entity Maps for custom or out of box Dynamics CRM entities.
Understanding Maplytics Entity Maps:
Now let’s dive deep into every aspect of Maplytics Entity Maps and how it can help you to get the most of your Dynamics 365 CRM data visualization on the map.
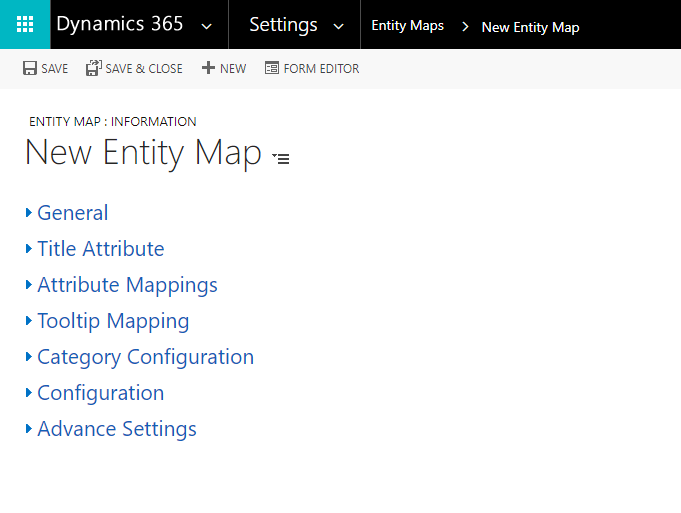
When you create a new Maplytics entity map, you will see the below sections. Every section allows you to configure the entity map further.
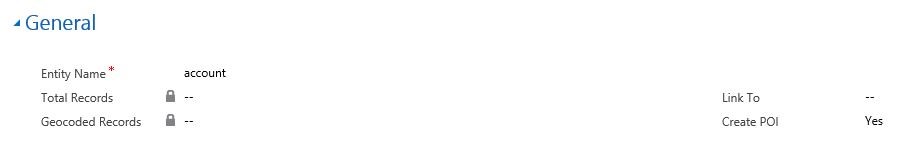
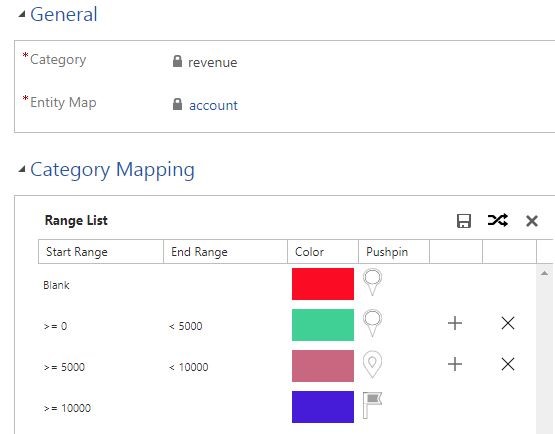
 1. General: This is where you specify for which entity you want to create the entity map by entering the logical name of the entity in the ‘Entity Name’ field. The user also has the option to easily use the related entity address for plotting the data on the map using the ‘Link To’ field.
For example, if you want to create Maplytics entity map for the Opportunity entity, in the ‘Link To’ field, you would need to mention the logical name of the ‘Potential Customer’ field on the opportunity record.
The user can also decide whether he wants to select the point of interest or nearby places geo-tagged data by Bing on the map. Here, the user can also easily monitor how many records exist for that entity and how many of those are geocoded.
2. Title Attribute: Users can also select the field attribute that they want to see on the hover over the individual pushpin of an entity by using the ‘Title Attribute’ section.
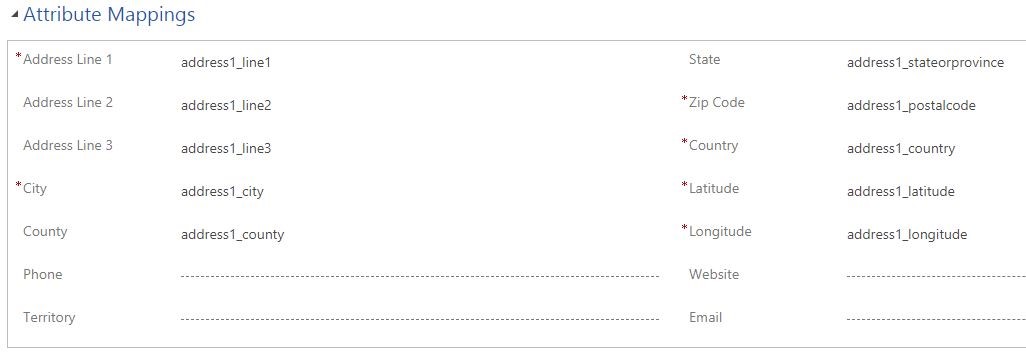
Users need to enter the logical name of the field attribute they would like to see on the hover.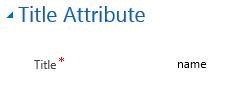 3. Attribute Mappings: Here the user needs to provide all the logical names of all the address fields which will then be used to plot the data on the map. If the user has linked the entity with a field attribute of its related entity, then the address fields should be that of the related entity.
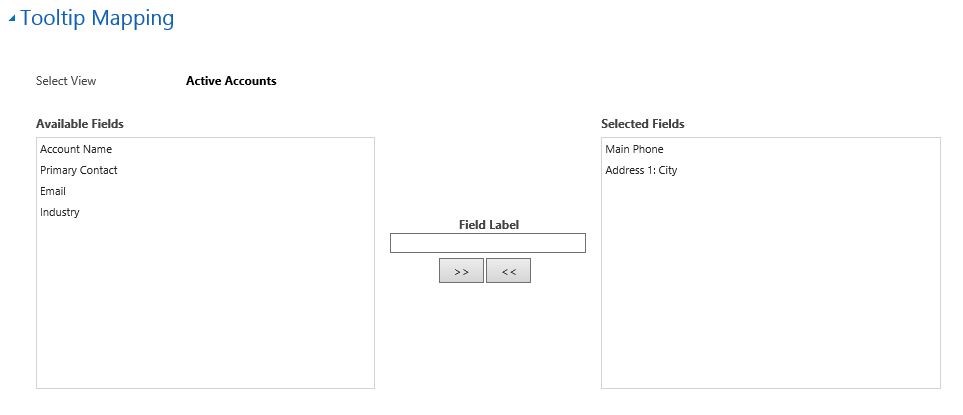
 4. Tooltip Mappings: This provides you the option to choose which information should be displayed on the Tooltip card that opens up on click of any pushpin on the map.
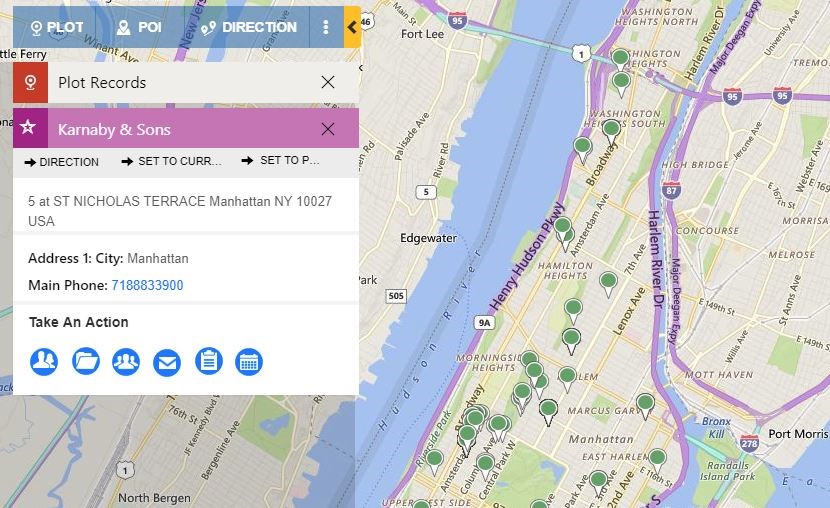
The user can also select the desired view of the entity and choose all the attributes that are required to be shown in the tooltip card. This makes it easy to analyze the data as one can see all the required information just on a click on the pushpin.
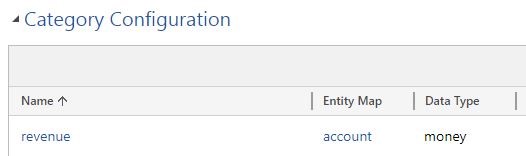
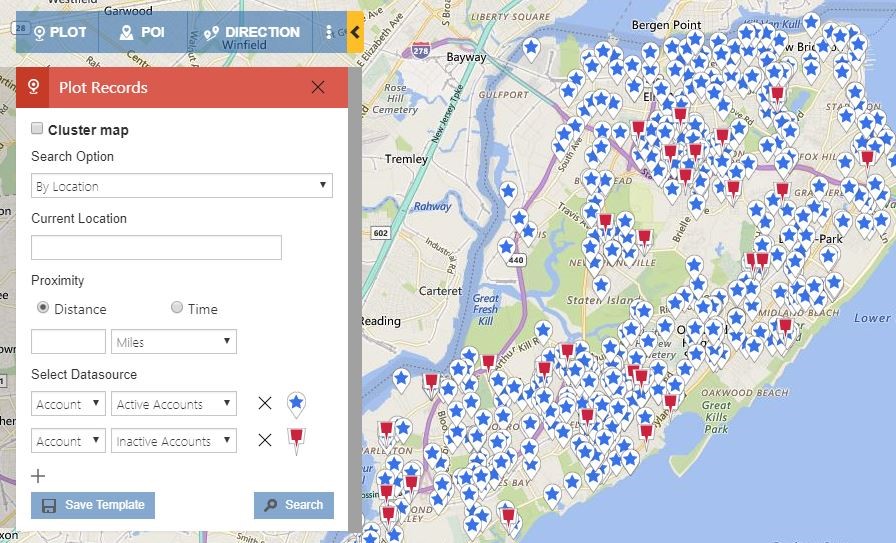
5. Category Configuration: Users can categorize the data based on any field attributes of that particular entity using the Category filter on the map. Once the data is plotted using the category filter, a card for that category will open on the map with the option to filter the data.
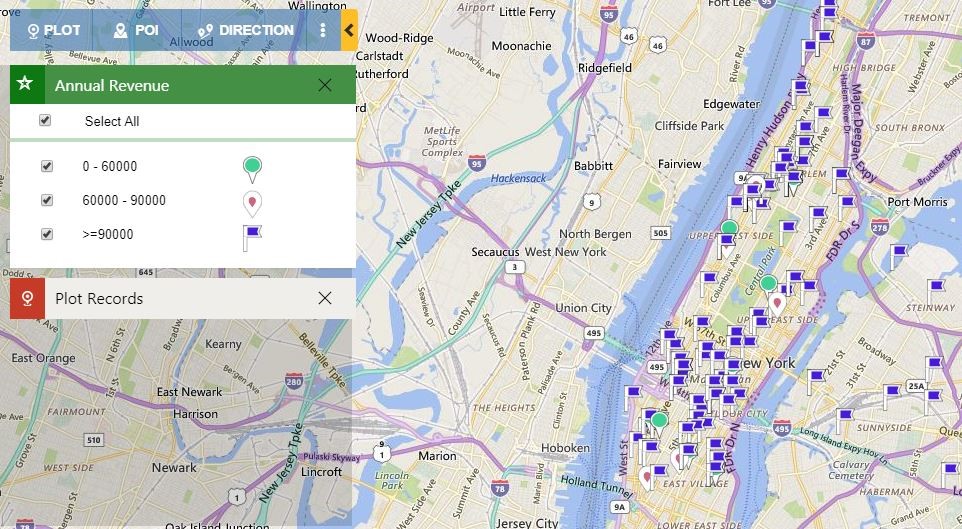
They can also select different colors for various ranges of the attribute. The users can also define the range based on their need.
6. Configuration: After plotting an entity user can also plot the related records of any particular data point. Click here to know more about plotting related records.
Users can select all the relationships that they want to be shown in the list to plot it on the map.
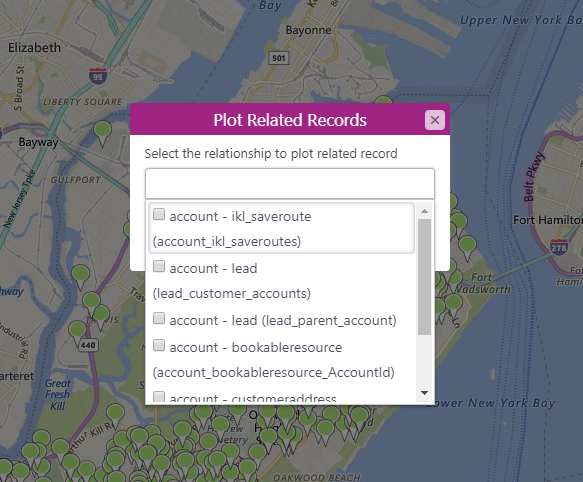
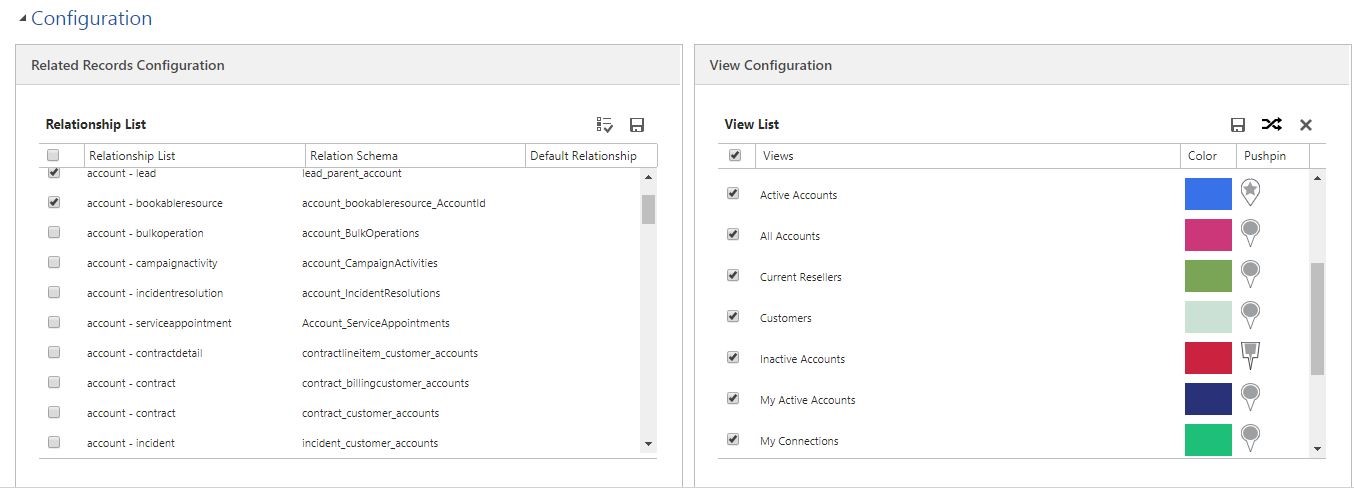
They can also choose the view of the entity that will be displayed in the list and also assign a color and pushpin shape for the different views.
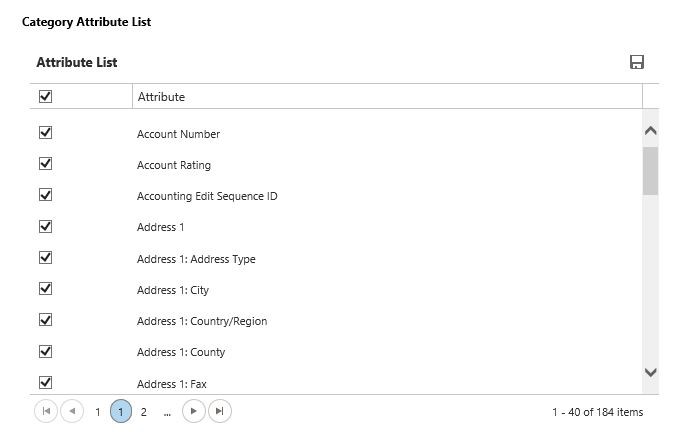
Here one can also select the attributes which will be shown in the list of the category attributes.
7. Advance settings:
A. Tooltip Card Actions: The tooltip card also provides many actions to perform right on the map screen.
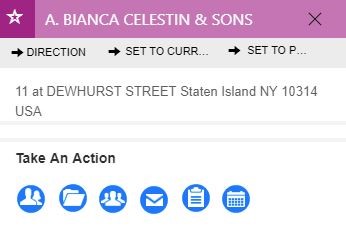
The user can define the actions on the Tooltip card using this section. The user can use a maximum of 7 actions. Three actions are added as default (i.e., Change Owner, Open Record and Plot Related Record). The user can select the required actions and icons which will be added to the tooltip actions.
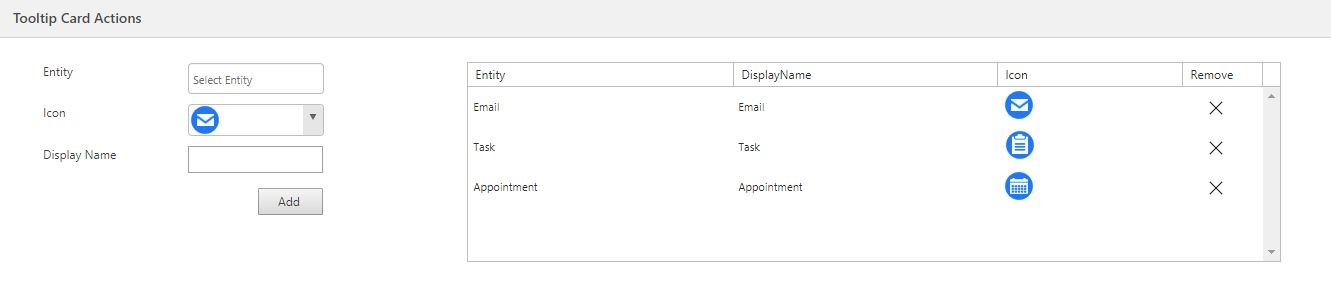
This makes it easy to perform actions like sending an email, saving an appointment, etc.
B. Summary Card: With the Summary card feature in Maplytics, the user can get aggregated information for any enclosed shape on the map.
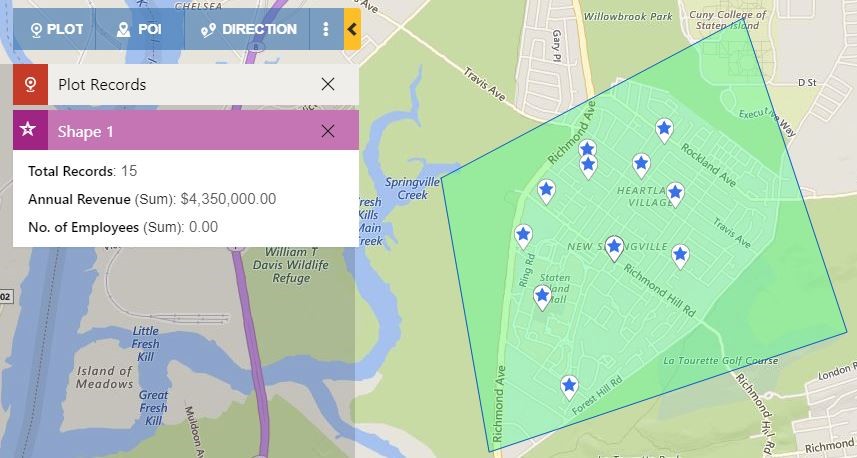
Users can select all the required attributes to be shown in the summary card along with the aggregate method (sum or average). This will calculate the data according to the method selected and will show the final result.
The user can add a maximum of 5 attributes for the summary.
C. Hover Attributes: Users can further select various attributes that will be shown when they hover over any pushpin.
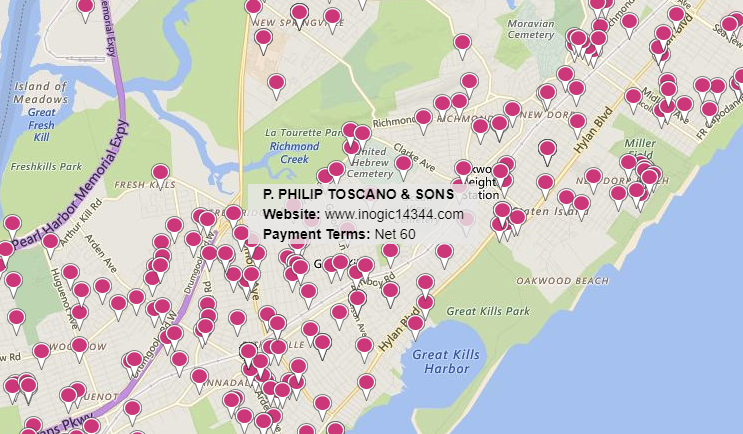
This way one can get a quick glance at the important information about a particular data record.
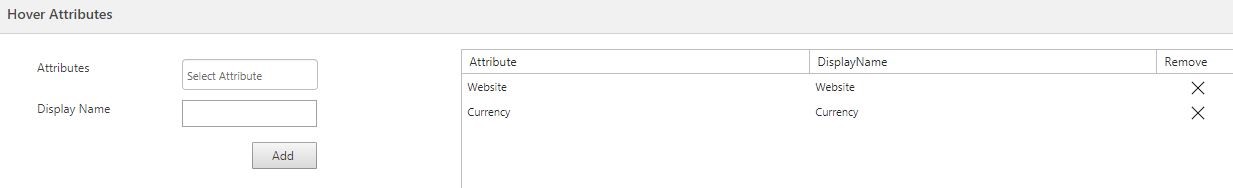
User can define a maximum of 6 Title Attribute.
By using the Maplytics Entity Maps, users can configure Maplytics to behave exactly how they want and add a context to the data plotted on the map. This is particularly useful when working on a set of CRM data in collaboration with other users. As everybody would see the data represented in the same way, the overall team can easily monitor and analyze the data and communicate efficiently knowing that everyone is on the same page.
Get a hand-on Maplytics experience and transform the way Dynamics 365 is analyzed. Get your 15 days free trial from our Website or Microsoft AppSource.


