Overlaying is a technique used by developers to customize metadata and source codes to suit their operational and business requirements.
 Overlay functionality in Maplytics enables Dynamics 365 CRM users to view CRM records along with data in shape/excel files, and existing territories pre-plotted on the map.
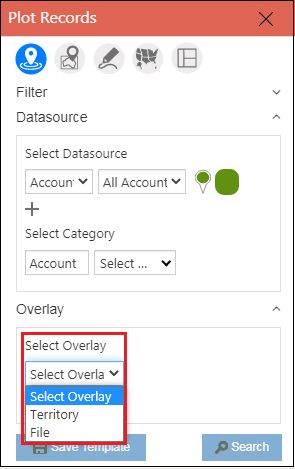
Users get to select records based on the following parameters, to view them on the map-:
- Territory – This option helps to select from the list of existing territories.
- File – This option helps to select from a list of saved shape/excel files. The file should be in the territory for it to be visible in the list.
Let us talk today about the journey of Tim, Sales and Marketing Manager in a Food and Beverage brand planning on Sales Area expansion. He would want to know the demographic detail of the Target Group in the new area. With information available about the population, their age groups, spending capacities, buying patterns, sex ratio, etc., categorizing them and designing marketing campaigns for them would be easier.
The sales processes can then be planned to cater to young adults, the working population, senior citizens, and so on. Combining the location data with demographics would help in better decision-making.
With the overlay feature, Tim would be able to-
- View the existing territories within the new area by plotting them over the map and know the headcount in all the territories along with other details, and
- Import external shape/ excel files, save them in CRM and plot the same over the map to view the territorial data in-depth
By viewing this organized data spread across the new sales area, Tim might decide on targeting 3 main territories with the right population age group and create marketing and sales plans for the young adults there.
Overlay by Territory
Users can select the option of Territory and the territories they want to plot. Along with this, they can also select any DataSource & view records along with the Overlay of selected territories.
As seen below, Tim has selected an overlay of 3 territories and plotted all the account records within them.

Overlay by File
Users can select an excel/shape file saved in CRM to plot the same on the map.
Category Attribute: An attribute can be selected to categorize the regions plotted by file.
Summary Attributes: One or more attributes can be selected to display their details in the Summary card.
Users can also uncheck the option of ‘Plot All Regions’ for selected viewing. This can be done by right-clicking at any location on the map to select the option of ‘Show region’ from the Contextual Menu.
Further, the user can also open the respective territory within which the file is saved using the ‘Open record’ button on the Summary card.

Save the Shape/Excel file in the territory
A file should be saved in a territory to be visible in the list of the files to be plotted as an Overlay. The same can be done using the following steps-
- Go to Settings > Business Management > Sales Territories > Create a sales territory > Save
- Go to Territory Map Preview > Select Option > Shapefile/Excel file > Save

Save Shapefile
Within the Territory Map preview, users can select the option of ‘Shape file’ and select the color to view the regions in the same.

Save Excel File
Within the Territory Map preview, users can select the option of ‘Excel File’ to pick an excel file for the territory. Users can also select the color to view the regions in the same. They further need to select the following options to save the excel file as per their requirement:
Select Region Type: If Tim is the user, he should select the region type based on which the boundaries of the regions from the excel file are to be plotted.
Select Region Value: Tim then needs to select the column from the excel file that contains the values for the selected Region Type.
Select Main Region: He needs to select the column from the excel file that contains the value for the largest region for the selected Region type to plot the regions accurately.
If the Region type selected is Postal code, the Main Region should be preferably Country. If the column of the country is not available then the column with the values for respective States or Cities can be selected.

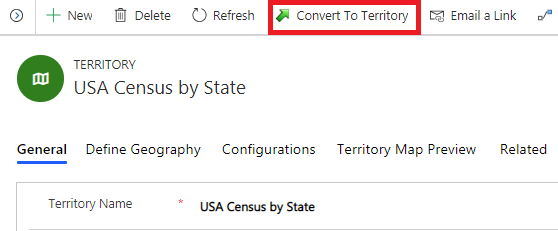
Convert Overlay to a territory
Users can use this button to convert an ‘overlay’ record to a territory. After the overlay record is converted, it becomes a territory that can be searched in the option of ‘Territory’ within Overlay.
 Benefits of Overlay
- Overlays can be utilized to integrate existing, saved CRM data with external, updated data for better decision making
- Circumstantial data such as weather forecasts, disasters caused due to cyclones, earthquake measurements, annual rainfall, etc. can be uploaded through an excel and used to strategize
- A better understanding of the region helps in creating new territories with newly added records.
This is great but is there more?
Apart from Overlays, Maplytics has been able to develop notable features like Proximity Search, Territory Management, Optimized Routing with turn-by-turn navigation and along-the-route, Appointment Planning, Truck Routing, Tracking Field reps with Real-Time Tracking, performance analysis of complex data with Heat Maps, Census Data and Shape Operations amongst others.
You can write to us at crm@inogic.com for your mapping queries, to explore the product further, a free trial of 15 days, or a personalized demo within Microsoft Dynamics 365 CRM / Dataverse.
For more on Maplytics, do visit our Website or Microsoft AppSource. For further details, you can hop on to our Blogs, Client Testimonials, and Video Library.
Until then,
Happy Overlaying!


