In this digital age, businesses are shifting their focus to digital business solutions. Dynamics 365 is a preferred business application that helps organizations to accelerate their growth. Businesses around the world store their important data on Dynamics 365. One of the main functionalities of Dynamics CRM is the ability to perform in-depth data analysis to gain meaningful insights.
Maplytics™ embraces the power of Dynamics CRM map integration with Bing Maps to allow users to plot entities and visualize their Dynamics CRM records on a map. The latest Jan Release has further added to the data visualization and analytics capabilities of Maplytics by adding the ability to Plot Related (Child) Records on a map Dynamics 365 CRM. This is really helpful while performing a drill-down analysis of a particular entity record on a map. Especially if that entity has many related records.
Suppose an organization wants to plot all the contacts associated with a particular Account. Using Maplytics, they can easily plot the Account with all its related contacts. Maplytics allows a user to plot 1: N relationships between two entities and perform in-depth analysis right on the map within Dynamics CRM!
Let us see how you can easily Plot Related Records on the Detail Map:
1. Navigate to Detail Map > Plot CRM records on the map.
2. Now, select the required record by clicking on Pushpin and click on the ‘Related Record’ button as shown below: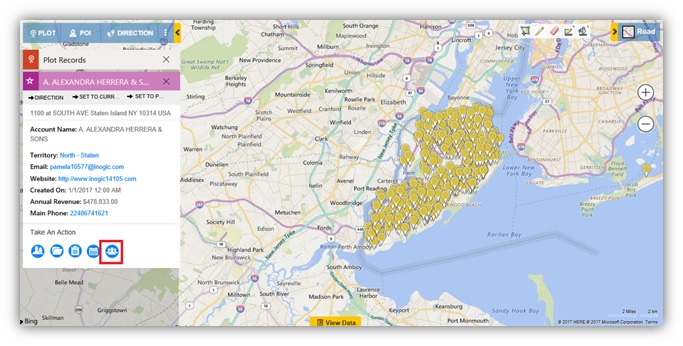 3. Select one or multiple relationship(s) from drop down and click on ‘Plot Records’ buttons:
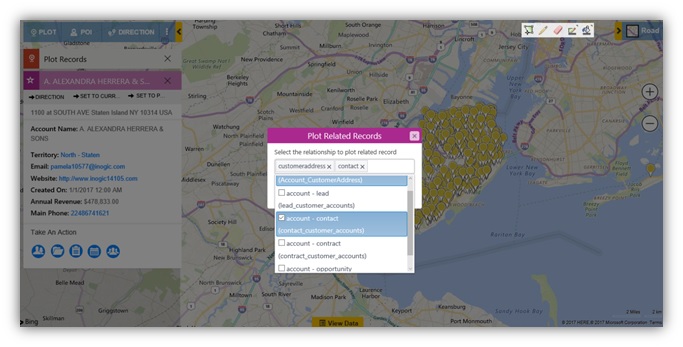 4. All the relationships are assigned a different color pushpins as seen in the screenshot below:
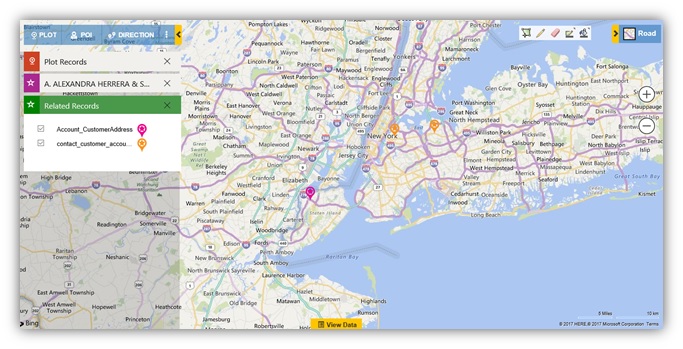 Note: Users can plot maximum of three relationship here.
5. Click on ‘View Data’ button to open the grid. All the related (child) records data can be seen in the grid. A new button ‘Parent Records’ is added in the grid to access Parent and Related (Child) records as shown in the screenshot below;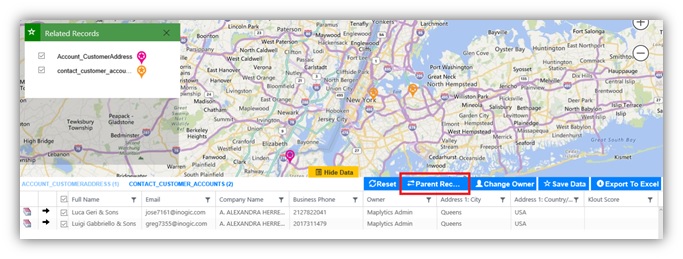 6. After switching back to ‘Parent Records’, the button changes to ‘Related Records’. User can switch to the Related (child) records by clicking on this button.
Conclusion:
Maplytics integrates Bing Maps with Dynamics 365 CRM records and allow users to visualize their CRM data on a map. Organizations can analyze Dynamics CRM data effectively by plotting Parent and Related (Child) records on a map using Maplytics!


