
Filtering is one of the most useful methods that reduces a lot of effort while working with huge data. While Maplytics (Preferred app on Microsoft AppSource) provides geographical insights on the CRM data, it also provides the option to categorize and filter your records based on your required attributes to focus only on the required data.
Using Maplytics, users can plot their Dynamics 365 data and use the categorization option to categorize the data based on the required attributes. They can categorize multiple entities as well as a single entity on multiple attributes. This helps the users to focus on the data from the required categories. After categorizing the entities, if the user needs to further narrow down the records, they can use the option of the filter from the ‘Data Grid’. Let’s understand how can we filter the records using the Data Grid with an example.
Barry has been working as the sales manager for his company. He has been using Maplytics in order to plan schedules for his field sales team. He recently participated in an exhibition to showcase his products. He wants to analyze the type of clients and invite all his clients who are within the postal code and nearby, to come visit the exhibition and also take testers of the latest range of products.
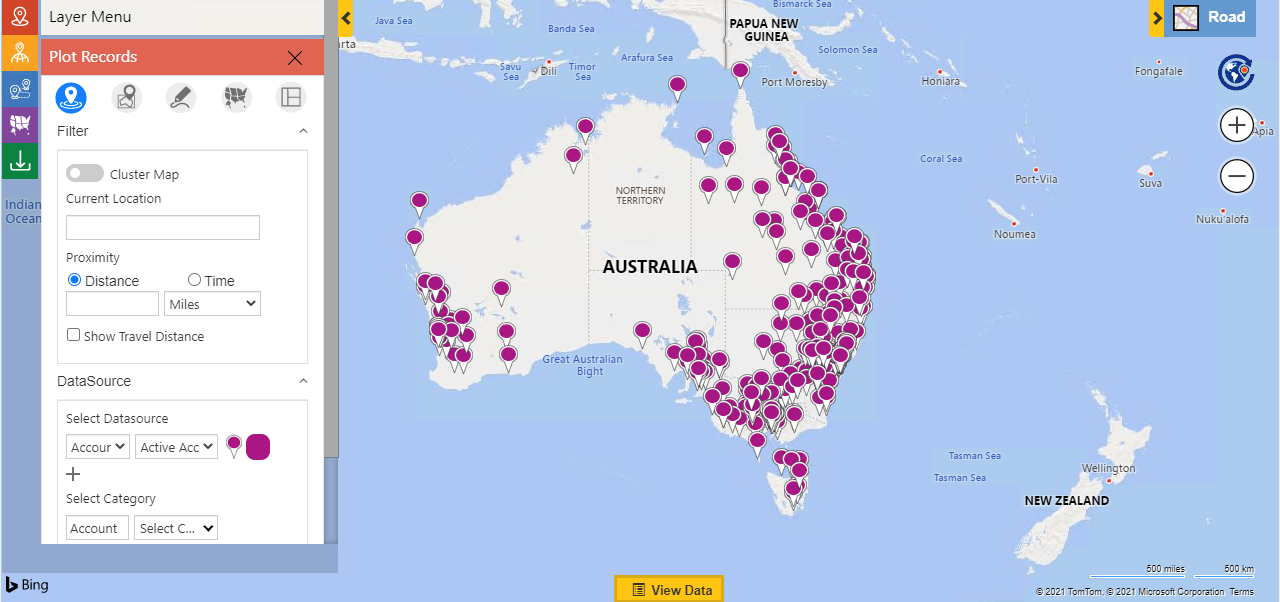
To do this, he first plots clients on the map to visualize the location of the clients geographically on the map.
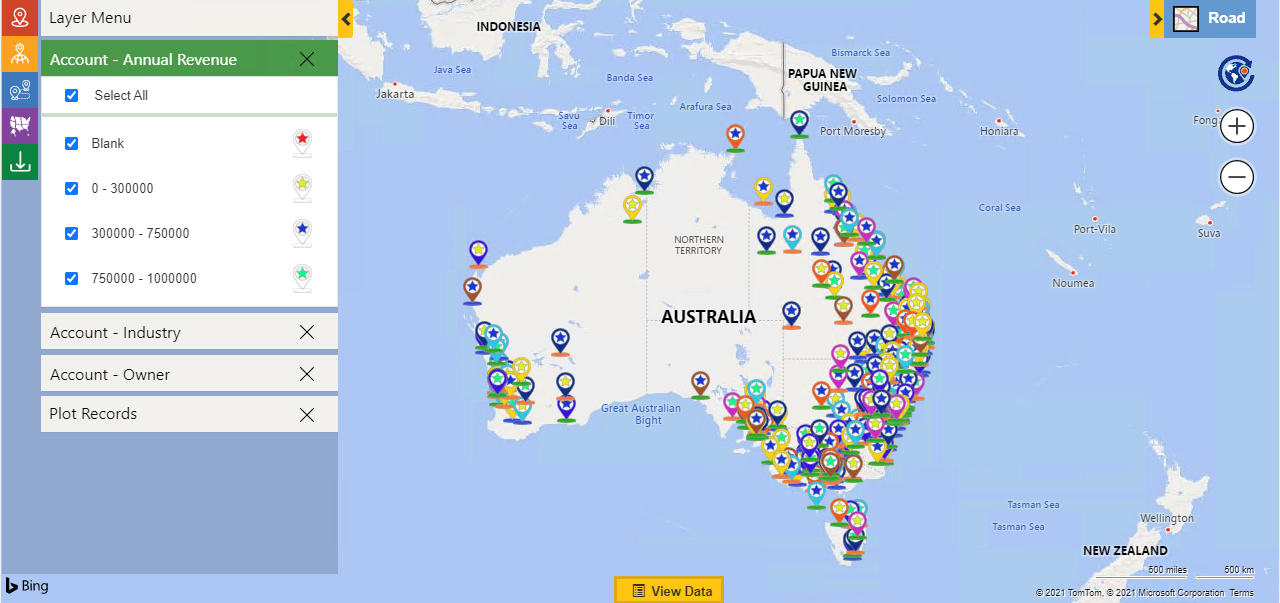
To better understand his clients, he categorizes the clients plotted on the map based on Annual revenue, Industry and, Owners. This color codes the records due to which Barry is able to understand better which records are able to give higher or lower annual revenue or the industries the clients are in. The category card helps him to differentiate between different records.
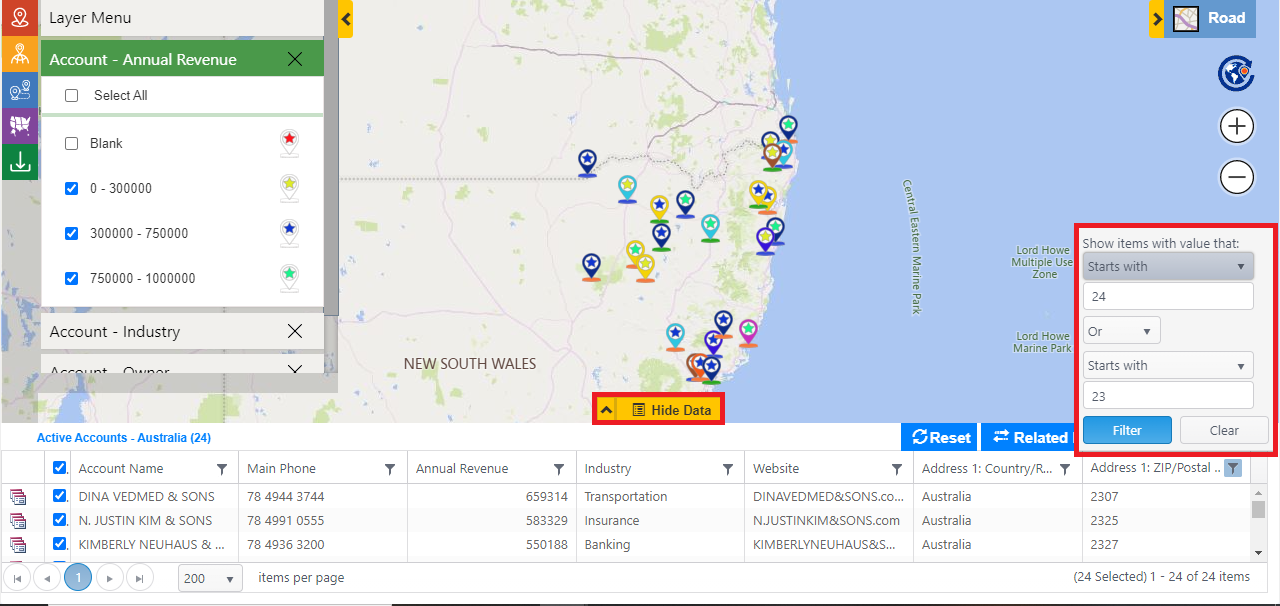
Now he has plotted the records on the map along with categorization. He further wants to filter the records based on the zip codes nearby the exhibition. He simply opens the Data Grid, clicks on the filter icon to select the filter option of ‘Starts with’, and enters the value of 24 or 23. He can also select filter icons for other columns to filter the data further based on other attributes.
He can further click on the resize button to drag and resize the data grid or double click on resize button to open the data grid to the maximum size to check the information about the resultant records.
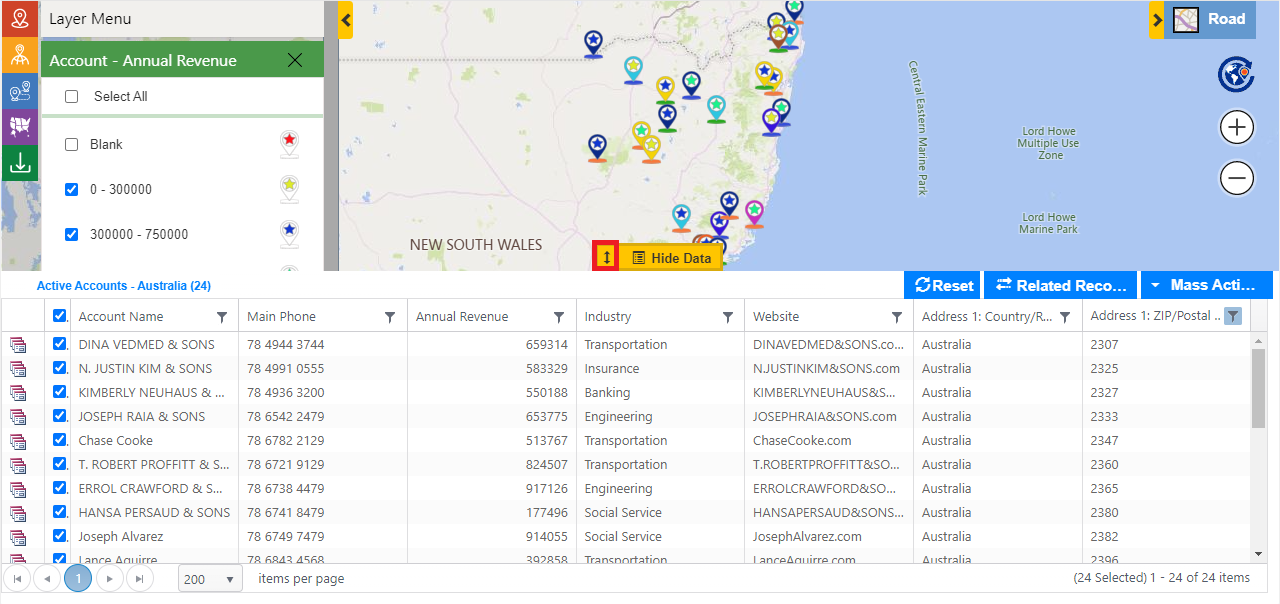
This way he can categorize the records on the map and further filter down the records based on multiple attributes. This helps him to narrow down the CRM data focus only on the required clients, and proceed ahead with the invitation of the mails for the exhibition to the resultant client records. He uses the option of ‘Send emails’ from the ‘Mass actions’ to send the invite to all the resultant client records.
Check out our Video Library to go through the features of Maplytics along with the latest additions from the latest release. Share your mapping needs at crm@inogic.com and schedule a free demo and Q/A session especially based on your mapping requirements.


