
Sales teams are under intense pressure to deliver results, adapt quickly, and base their decisions on real data.
If you’re using Microsoft Dynamics 365, you already know the power of a centralized CRM, but managing sales analytics within it can still be overwhelming.
Massive datasets, multilingual customer records, and cross-border territories in regions like the US, UK, Canada, and Australia can make it difficult to see clear patterns.
Why Streamlined Sales Analytics Matter for Dynamics 365 Users
Complex spreadsheets and static dashboards just don’t cut it anymore. Sales managers and reps need to:
- Identify where prospects are concentrated
- Evaluate which territories perform best
- Optimize routes and appointments
- Strategize in real-time
In multiple regions — from US states to UK counties to Canadian provinces and Australian regions — these challenges multiply. Slow, disconnected analytics leads to missed deals, wasted travel time, and poor decision-making.
Solution? – Location Intelligence Inside Dynamics 365
That’s where Maplytics – a Microsoft Certified, Geo-Spatial app for Dynamics 365 CRM steps in, transforming static CRM data into dynamic, map-based visualizations, making your sales analysis easier, faster, and more actionable than ever.
Maplytics bridges this gap by visualizing Dynamics 365 sales data on an interactive map. Here’s how it transforms your day-to-day sales strategy:
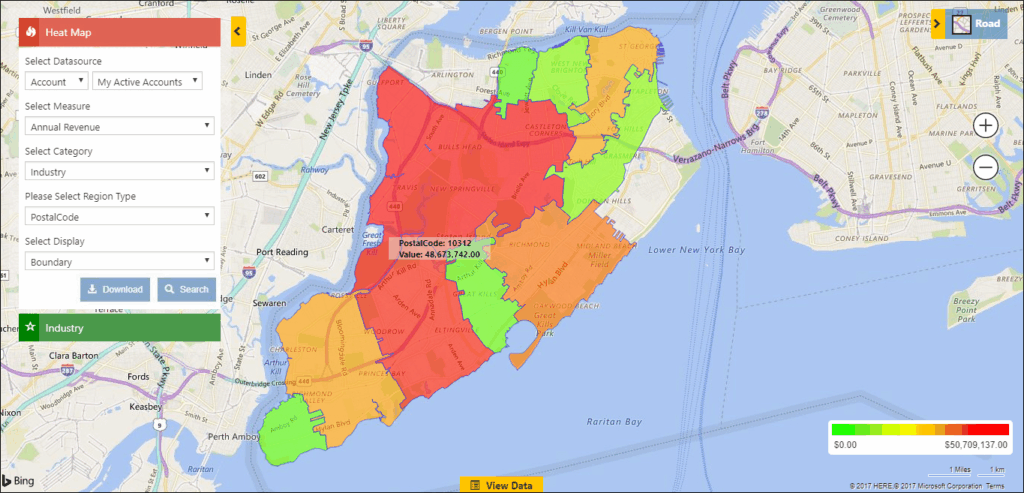
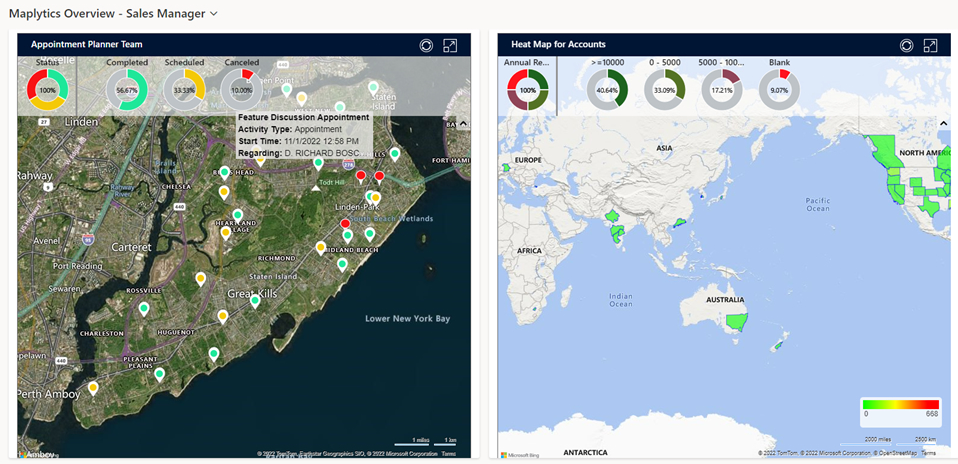
Heat Maps
Quickly spot high-performing areas, underserved regions, and customer density at a glance, using intuitive heat maps. Also, get instant, summarized insights of your mapped data with quick totals and average metrics right on the heat map. With this, you can:
- Visualize customer and sales data density instantly
- Identify patterns and performance gaps with color-coded maps
- Simplify territory planning and resource allocation
- Enable data-driven, faster business decisions
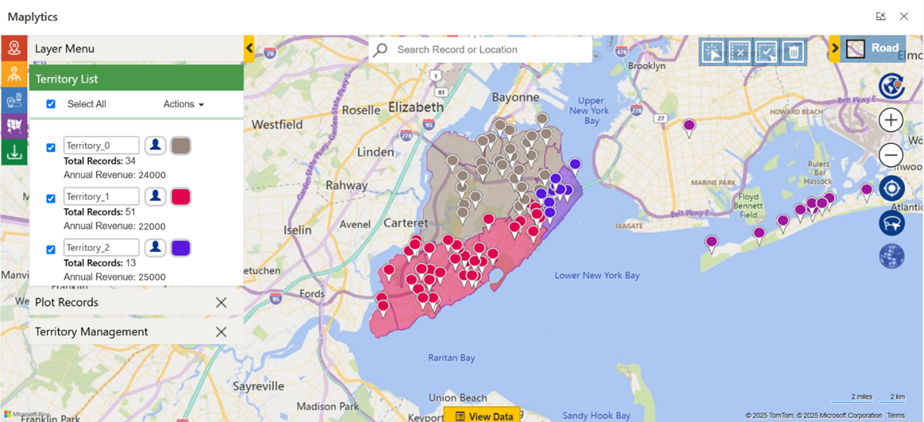
Territory Management
Create, monitor, and adjust sales territories with drag-and-drop ease, ensuring balanced workloads and efficient coverage. With this, you can:
- Design, draft, and edit territories easily with intuitive, drag-and-drop tools.
- Balance sales workloads and improve resource allocation across regions.
- Monitor territory performance to identify gaps and growth opportunities.
- Enhance coverage and responsiveness by realigning territories as business needs change.
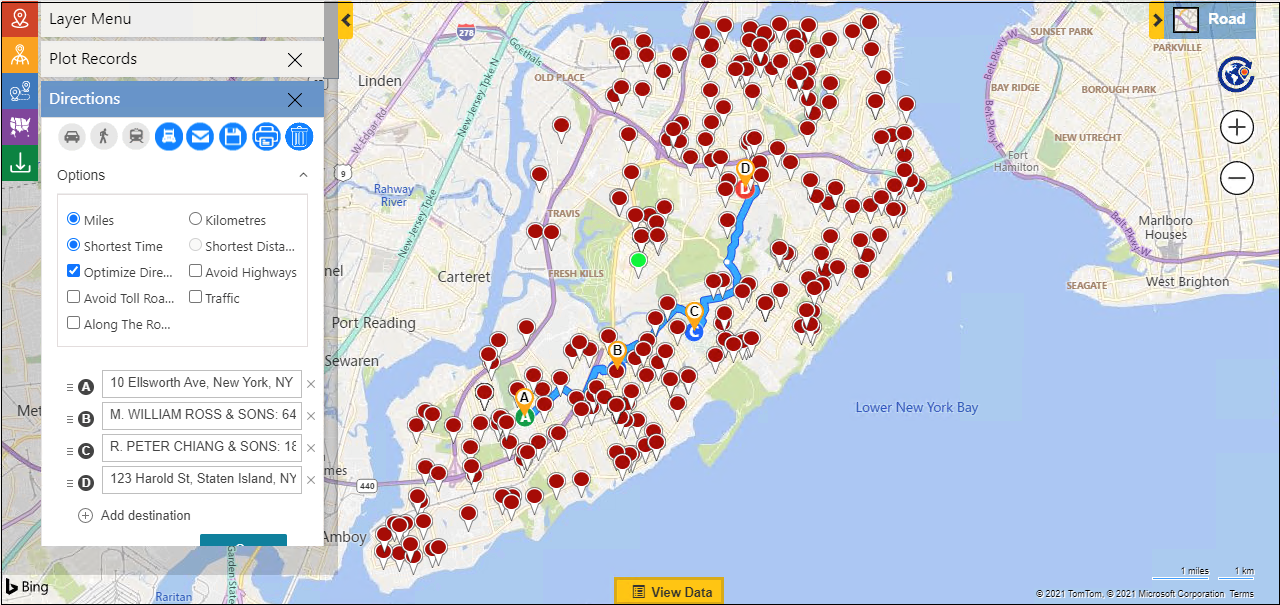
Route Optimization
Plan the fastest, most fuel-efficient routes for your field reps, saving time, reducing travel expenses, and maximizing meeting capacity. With this, you can:
- Plan the quickest and most fuel-efficient routes for field reps.
- Minimizes travel time and expenses for more cost-effective visits.
- Maximizes the number of appointments or meetings per day.
- Adapts routes dynamically to avoid delays and improve productivity.
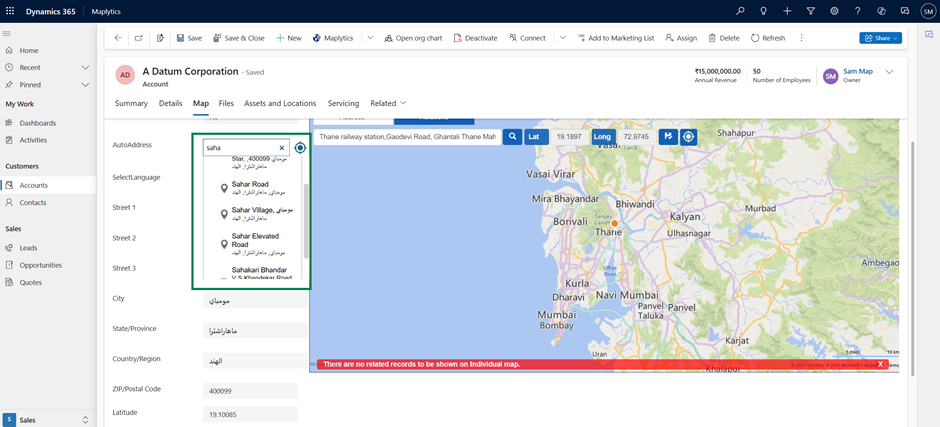
Multilingual Support
Maplytics supports 10+ multiple languages, making it easier for globally distributed sales teams to collaborate and understand shared data.
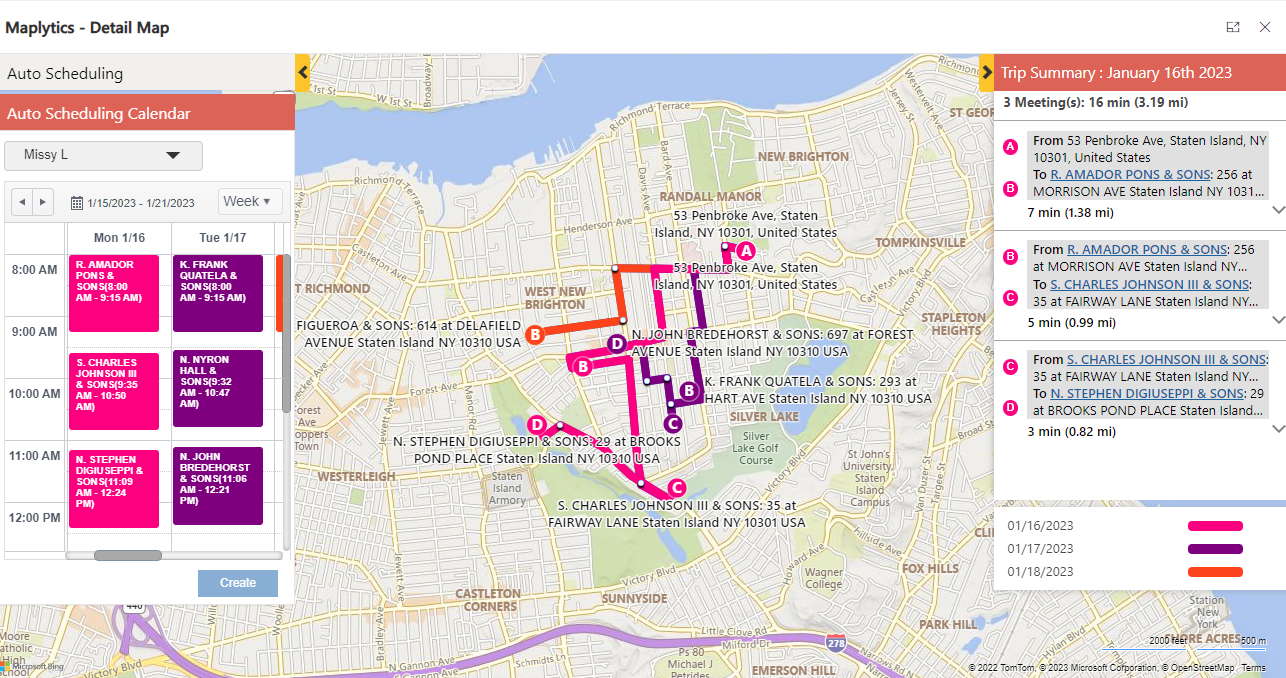
Appointment Planning
Easily schedule, reschedule, and optimize on-the-go appointments with an intuitive map-based calendar view. Also, auto-schedule the field reps’ workload based on skills, availability, and role. With this, you can:
- Automatically plan and assign appointments based on rep skills, role, and availability.
- Optimize field reps’ daily routes for maximum efficiency and minimal travel time.
- Balance workloads and reduce scheduling conflicts to boost field productivity.
Geo-Analytical Dashboards
Track territory KPIs visually, monitor rep performance, and stay on top of your targets — all within your familiar Dynamics 365 environment. With this, you can:
- Visually track territory and sales performance KPIs in real-time.
- Monitor rep activities and results on an interactive map-based dashboard.
- Identify growth opportunities and performance gaps quickly.
- Stay aligned with targets using clear, location-based metrics inside Dynamics 365.
Real-World Success Stories
Dynamics 365 CRM Mapping in the US
Field reps covering large states like California or Texas use Maplytics to plan optimized routes and reduce drive time by up to 30%.
Dynamics 365 CRM Mapping in the UK
Sales managers track customer density across counties, redesign territories to balance workloads, and reallocate resources to growing markets.
Dynamics 365 CRM Mapping in Canada
Field sales teams in Toronto and Vancouver use appointment planners to maximize daily meetings without retracing their steps.
Dynamics 365 CRM Mapping in Australia
National sales teams break down territory performance by state, identify high-potential zones, and launch new campaigns faster than ever.
Frequently Asked Questions about Maplytics by Sales Professionals
Q1. Is Maplytics suitable for both small and enterprise-level sales teams?
A: Yes, Maplytics scales beautifully whether you have 5 field reps or 5000.
Q2. How does Maplytics handle multilingual data?
A: Maplytics fully supports multilingual data to enable seamless collaboration among international teams. In addition to English as the default language, Maplytics currently supports German, French, Spanish, Portuguese, Turkish, Hungarian, Dutch, Arabic, Italian, Polish, and Russian. This allows users across different regions to access and interpret location intelligence in their preferred language, enhancing productivity and reducing the risk of miscommunication.
Q3. Can Maplytics manage territories across multiple countries?
A: Absolutely. You can design, manage, and monitor territories in the US, UK, Canada, Australia, and beyond.
Q4. Can Maplytics automatically schedule optimized routes for field reps?
A: Absolutely. Maplytics can auto-schedule appointments and plan the most efficient routes, helping reps save travel time and meet more customers in a day.
Q5. Does Maplytics support visualizing data through heat maps?
A: Yes, Maplytics lets you create powerful heat maps to instantly visualize data density, trends, and patterns, making territory and sales analysis easier than ever.
Q6. Can Maplytics integrate with Microsoft Azure Maps?
A: Definitely. Maplytics is natively built on the Microsoft platform and integrates seamlessly with Azure Maps, ensuring secure, scalable, and high-performance mapping within Dynamics 365.
Wrapping Up,
Sales analytics should empower you, not slow you down.
With Maplytics, your Dynamics 365 CRM transforms into a visual powerhouse, providing heat maps, territory insights, and route optimization tools to drive smarter, faster decisions.
Whether you’re in New York, London, Toronto, or Sydney, Maplytics helps your team close deals more efficiently, optimize resources, and stay ahead of the competition.
Want to see it in action?
Take a 15-day free trial from our website or book a personalized demo to experience its full potential.
Explore our Blogs, Client Testimonials, Success Stories, Industry Applications, and Video Library to see how businesses are leveraging Maps integration for their Dynamics 365 / PowerApps / Canvas Apps/ Dataverse.
Have questions?
Reach out to our team at crm@inogic.com or visit Microsoft AppSource to get started today!
Till then,
Happy Sales Analytical Geo-Mapping! 😊


