Census data provides demographic, social and economic information of the population in a region. It helps businesses to understand the social, economic, and demographic conditions and analyse and expand their business to different regions in a much robust way. With the help of the Overlay feature within Maplytics, user can plot Census data provided by Maplytics.
As we are already familiar with the ‘license registration’ section for Maplytics, we have a ‘configure’ button which helps the user to create Entity maps dashboards within Dynamics CRM. Here we have added a new section for configuring census data where we provide census data for USA by default. You can also plot your own census data as well on a map. To configure census data within Dynamics 365 CRM, user has to follow the steps mentioned below:
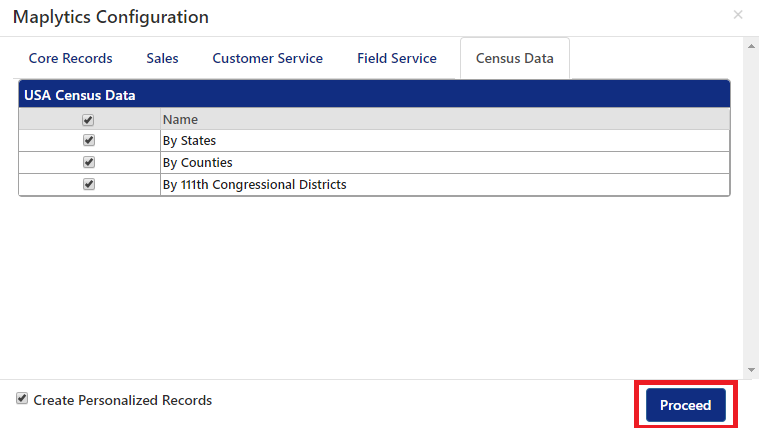
Go to Settings > license registration > Configure > Census data
User can select the default Census data available and click on ‘Proceed’ to configure the same.
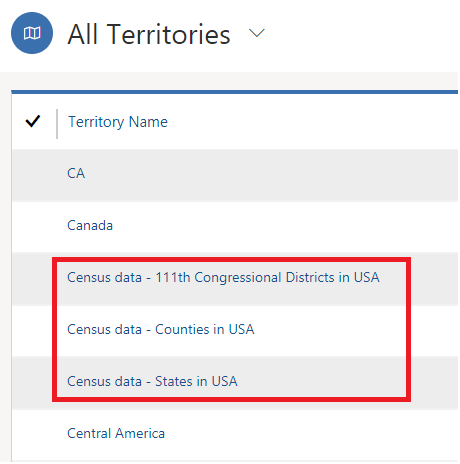
This configuration will save the Census data shape files in the Dynamics CRM entity of Territories just like the shape files are saved in order to plot it on the map.
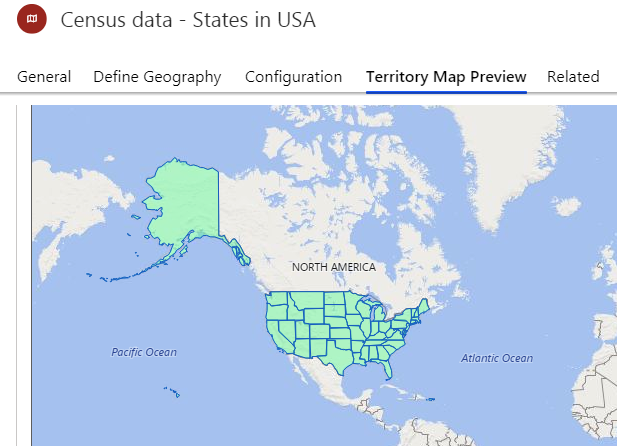
User can go to the territory map preview to see how the census data would look on the map.
To augment the census data analysis, we have added the options to configure the data for the census.
Configure census data
To configure the census data user can go to the configuration section in the territories. User can configure the data based on their preference for visualization. User can configure the Summary attribute, Hover attributes, Data grid attributes, and Categories.
Let’s take an example of a use case for an organization to understand the use of configuration and visualizing the configured Census data on a map. Stella, the owner, her business of kids clothing’s has various stores in Indiana and Ohio, USA. Now she wants to expand her business into new markets around. Now, let us see how Census data would her help to decide the best market for opening new stores.
From the default census data files, she would be using the Census data – States in the USA. To configure it, she would follow the steps mentioned below:
Go to Settings > Territories > Census data – States in USA > Configuration
Attributes configuration
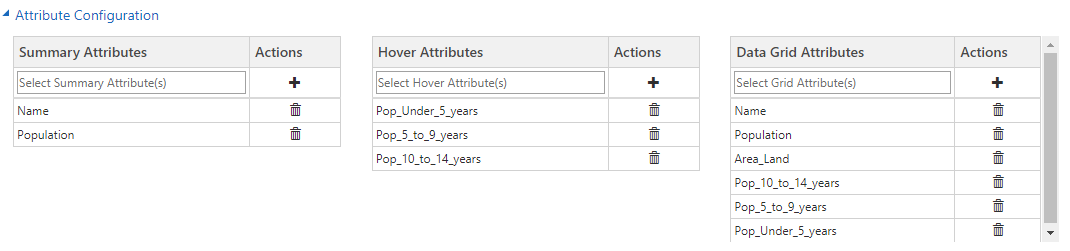
- Summary Attributes:
User can select the attributes to show on the Summary card shown on the click on the regions in the census data/shape file plotted on the map. Stella selects the attributes ‘Names’ and ‘Population’ to view the same in the summary card.
- Hover Attributes:
User can select at a maximum of 6 attributes that will be shown on the hover on the regions in the census data/shape file plotted on the map. Stella selects the attributes for ‘Population under 5 years’, ‘between 5 to 9 years’ and ‘between 10 to 14 years’.
- Data grid Attributes:
User can select the attributes from the census data/shape file to be shown as columns in the data grid in Detail map. Stella selects ‘Name’, ‘Population’, ‘Area_Land’, ‘Population under 5 years’, ‘5 to 9 years’ and between ‘10 to 14 years’.
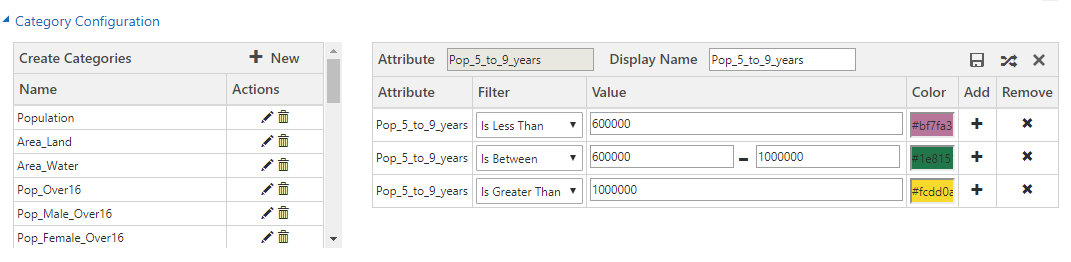
Category configuration
User can create categories for the attributes in the census data/shape file with various ranges for the data. Some of the categories are available by default. Stella’s primary market is of kids of the age of 5 to 9 years. So, within Category configuration she selects the category for the population of 5-9 years and configures it to get the desired colours for various ranges of the data.
Now that she is ready with the configured census data. She now plots the Census data so as to analyze the same to find a potential market where she can open new stores for her business.
To plot the census data, she can follow the steps mentioned below:
Open the Detail map > Overlay > Shape files > Census data – States in the USA. Also, she selects the attribute for population within age 5 to 9 years so as to visualize the categorized Census data she just configured.
After clicking on search the Census data will get plotted as shown below.
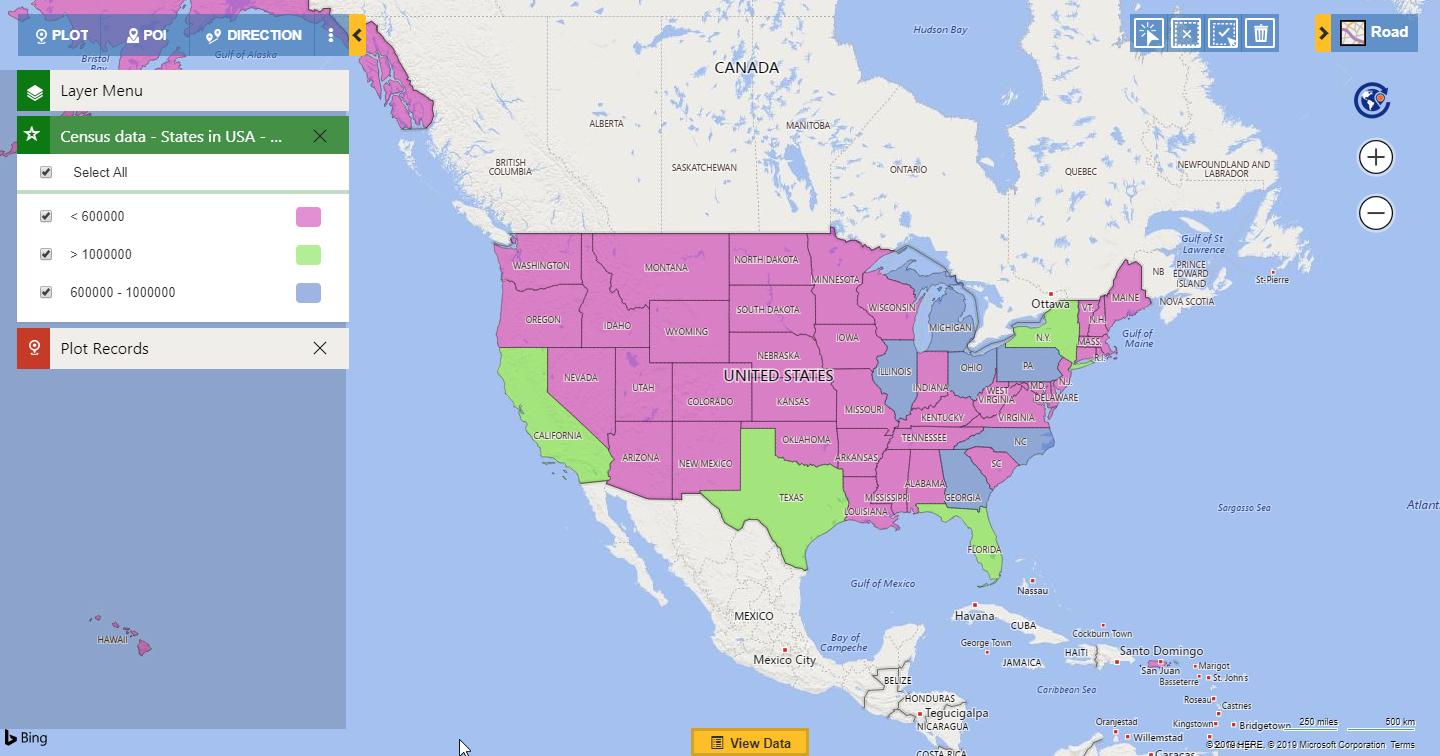
Stella can easily differentiate between the regions having different ranges of the population within the age of 5 to 9 years with the help of the category card. She can easily visualize that the highest population of kids of age between 5 to 9 years exists in Pennsylvania which is a potential market for her business. Based on this Census data, she now decides to perform further surveys and campaigns to know more about the market of Pennsylvania and will open new stores for her business here.
Thus, users can use the valuable information of Census data for regional population analysis and taking decisions for their business. Configure the Census data in your CRM now and incorporate advanced analysis within your organizational processes.
If you have not yet updated the Maplytics solution in your Dynamics CRM to its latest version. Please click here to download the zip folder for the solution as per your Dynamics CRM and configure the census data to get started.


