Imagine, you are the Senior Sales Manager of a Pharmaceutical brand. Your company recently introduced a syrup version of medicine for kids which already had a tablet version for adults. Now in a monthly Planning Meeting, you are presenting the difference observed in the sales areas after the introduction of the syrup. You have decided to present the figures region-wise.
However, to check the sales density visually, you are asked to represent the difference in the sales by plotting the CRM records on maps in Dynamics 365 CRM. This task can be easily achieved by representing the pushpins for syrup and tablets using two different colors. Instead, to provide a clear data visualization, custom pushpins can be used. One of the pushpins can hold the image of a syrup bottle and the other can be a strip of tablets. Thus, when plotted over the map, the respective sales areas could be checked at a glance.
The process to create custom pushpins is straightforward. Only the image or icon needs to be added to the default configuration record and they could be used as pushpins. For the exact process and other details check out our blog Twitter, LinkedIn, or your Product icon as Pushpins – Another smart way to analyze your Dynamics 365 CRM Data on Maps.
Color-coded pushpins are easier to assign. But which color has been assigned for which particular activity needs to be decided, listed out every time, and remembered. Analysing thus becomes time-consuming and confusing.
Let’s explore a few industries where custom pushpins can make that difference
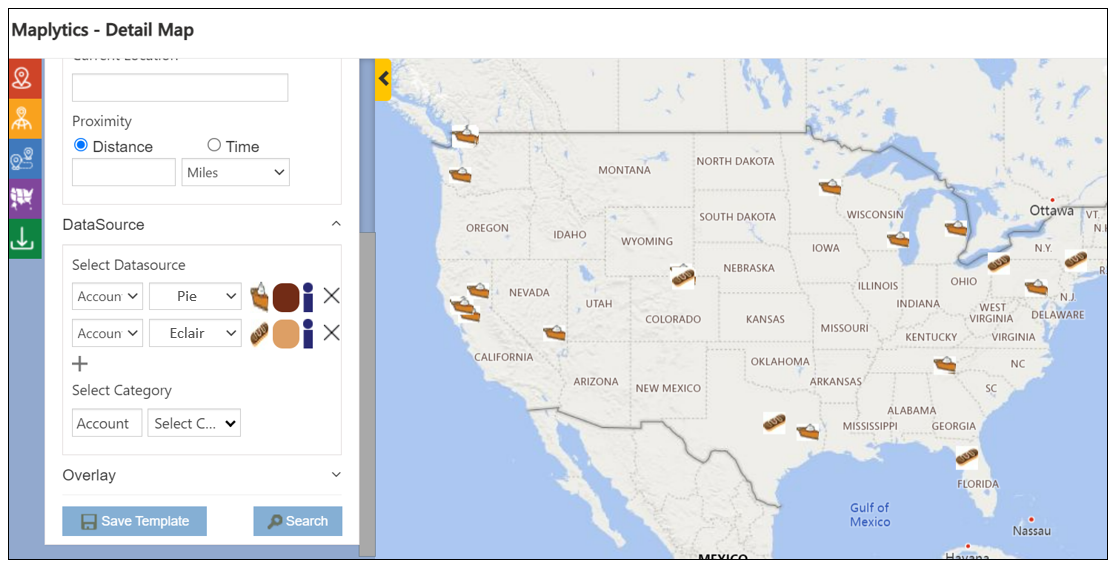
While deciding on bringing back the previous year’s Christmas Specials, a Bakery chain could use those dessert images as pushpins. Thus, when the demand or the sales in a particular state during the last year’s Christmas time would be plotted, the most popular desserts in that state could be visually understood, quickly. It would be easier for everybody to relate to them as well.
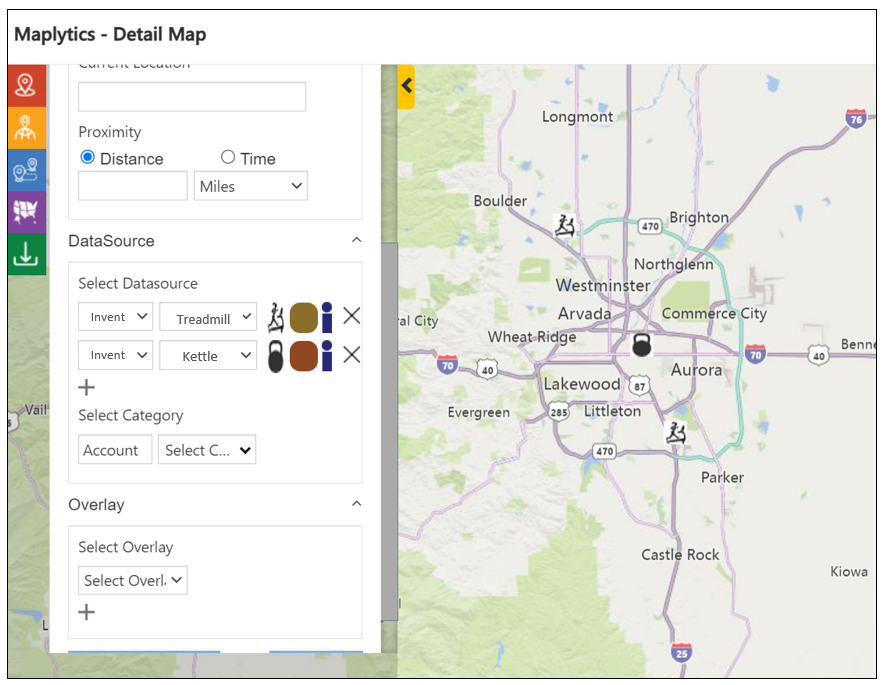
 A gym equipment manufacturer can keep a check on his inventory in all of his business territories and increase the production wherever the inventory of particular equipment seems to be falling.
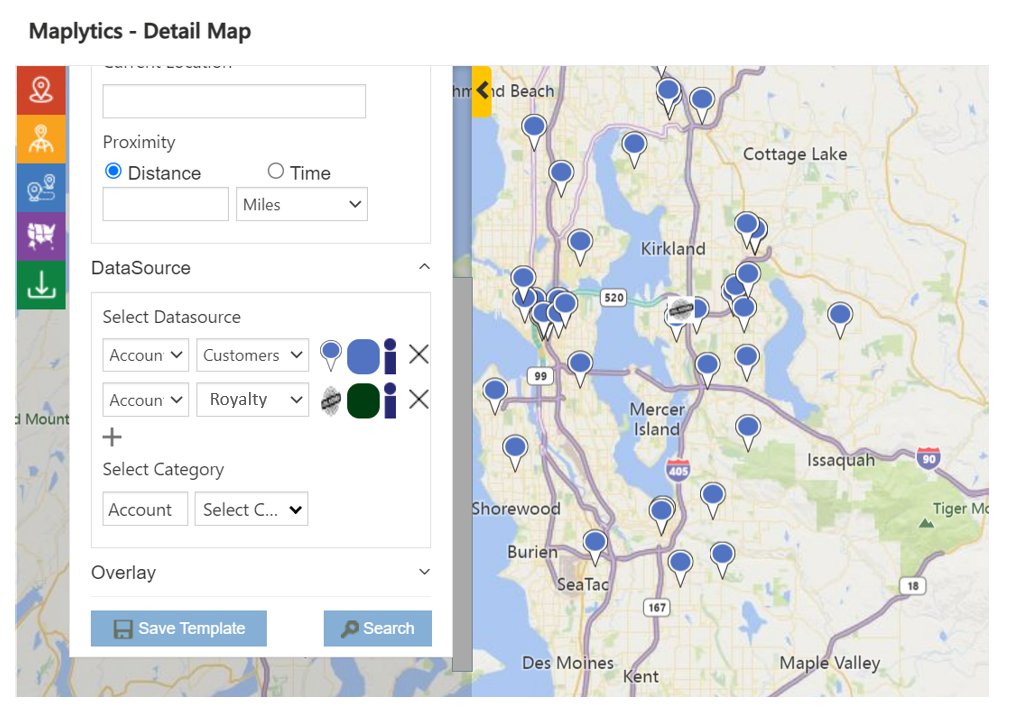
 If an airline has some loyal clients following their royalty plan for years, a royalty icon could be associated with them so that spotting them becomes easier whenever records are plotted for any search.
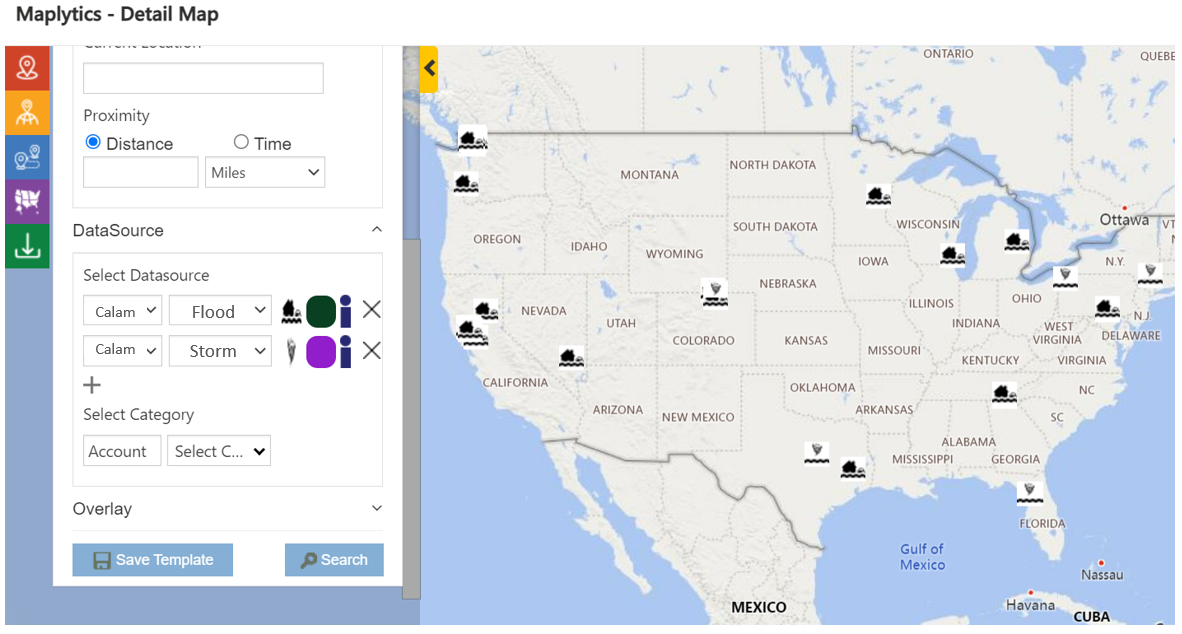
 In a country, the villages, cities, states affected by natural calamities could be associated with the image of the calamities faced. While planning out safety, security, and development plans for the next year, the government could plot these pushpin icons and make strategies to protect those areas from those calamities.
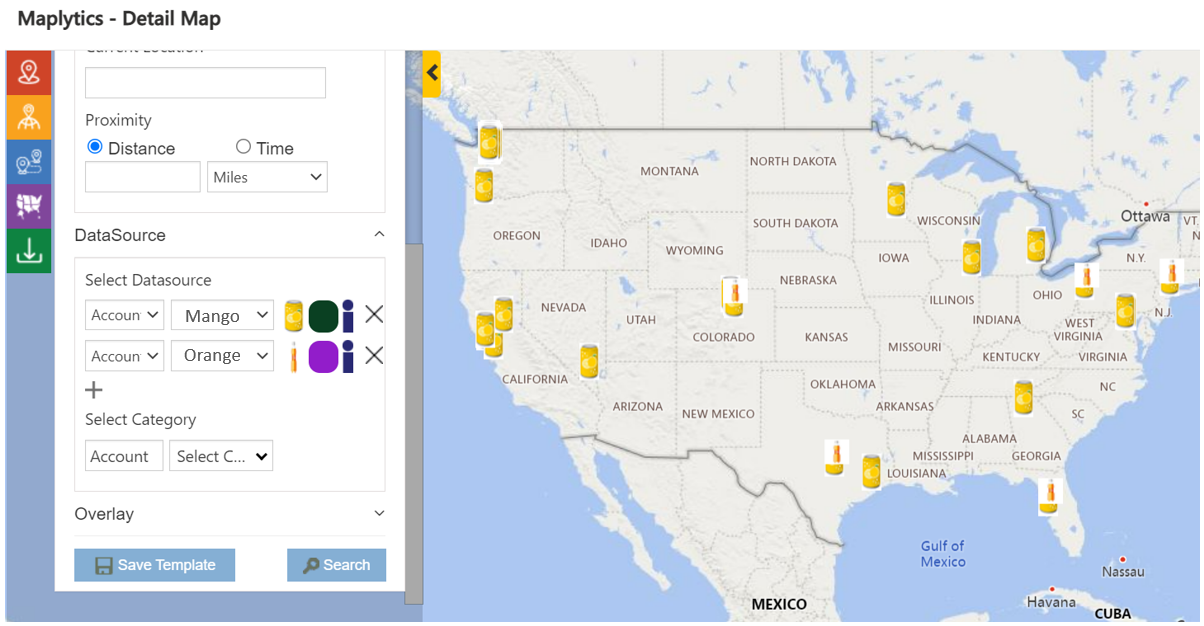
 If a soft drink company has introduced two variants in a particular country, they can use the images of the two variants as pushpins, plot the records of the sales in the various areas of the country for say six months and easily understand the preferred variant region-wise.
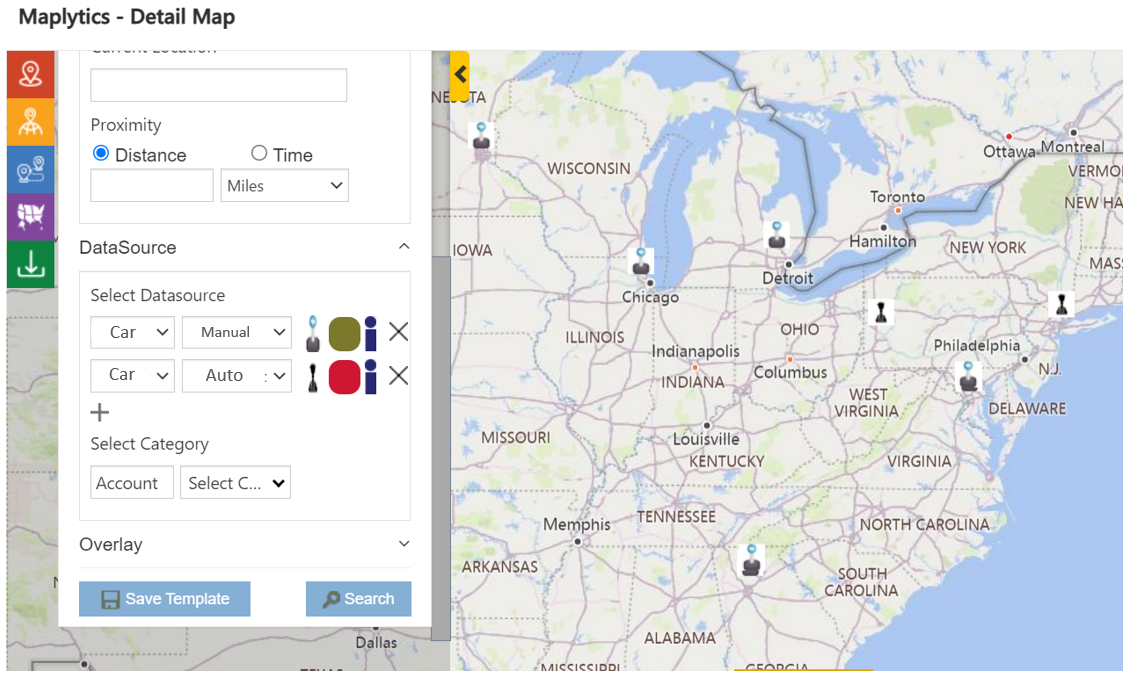
 If an Automobile giant wishes to take a survey on the public preference of an automatic car versus a manual car, they could conduct the ground level survey and use automatic and manual icons as pushpins to display the same. In higher management meetings, the areas preferring say manual cars could be easily spotted and the manufacturing could be strategized upon.
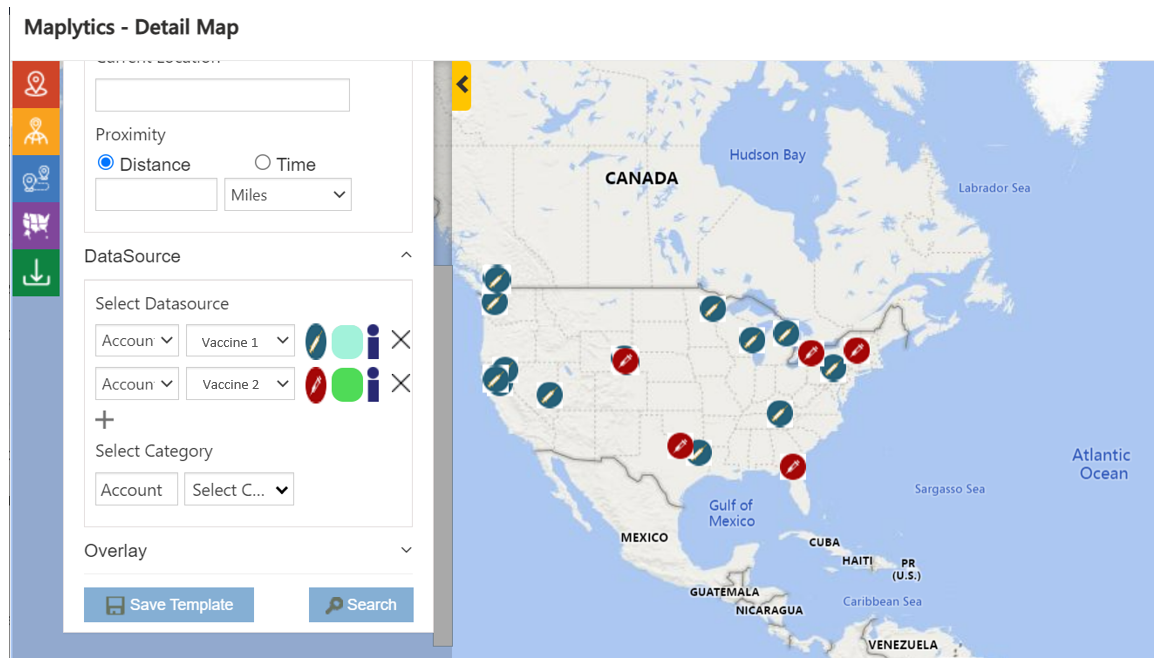
 In today’s day and age, the supply, usage, and inventory of various hospitals for particular COVID vaccines could be tracked, plotted, and acted upon using the distinct vaccine icons over the map.
Out of the choices available, which vaccine is available in which area can also be plotted.
 Thus, in the above examples, you have seen how by personalizing your pushpins, you can ease your entire business process and create an optimized view of your data.
Maplytics is popularly used within Dynamics 365 CRM for features such as Auto-Scheduling, Proximity Search, Territory Management, Route Optimization, and more. Microsoft Dynamics 365 CRM records integrated with Maps makes visualization an effective strategy in business decision making.
To explore this feature download the latest solution from our Website or Microsoft AppSource!
To discuss any of your Location Intelligence requirements drop an email at crm@inogic.com


