Know ‘Where’ your Data Is
Visualize client locations on maps and use location analytics for better business strategy.
#CustomersForLife
Map Dynamics 365 CRM Data
Visualize your Microsoft Dynamics 365 CRM data on a map using Location Intelligence
80% of the data has a locational aspect to it. If you use it correctly, it could lead to several location-based insights, helping with better decision-making!
Maplytics helps visualize Dynamics 365 CRM data on Azure/Bing maps. It enables you to plot the entities based on location, region, manually drawn shapes, defined territories, and saved templates. Not only can a user perform strategic analysis, but also take advantage of search features such as Concentric Proximity/Radius Search based on defined distance/time. You can save time by plotting templates in a few clicks, drag/resize the data grid to view the details of the records plotted on the map, and even zoom the map views and save them.
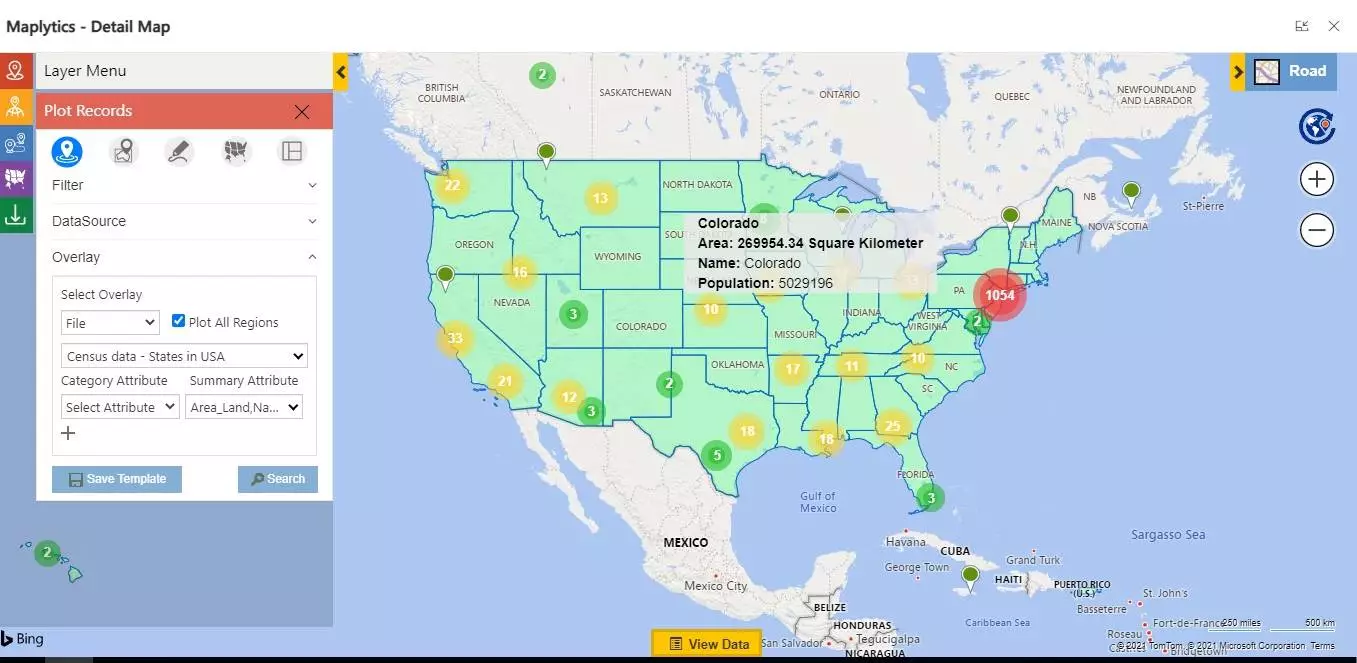
Conducting a Regional Analysis of the Dynamics 365 CRM data
You can easily view your Dynamics 365 data based on City, State, County, Postal/Zip Code, Postal Code Sector, Country, etc., on the Azure/Bing maps with Maplytics. Users can also see the summary of data spread in the Summary Card by clicking on any region of choice. The attributes could also be displayed on the Summary Card and could be customized as per individual business requirements.
Plotting & Searching external records on the Map
With Maplytics, you can also plot data from an Excel sheet directly on the map without adding it to the CRM. Specific records can be searched from the ones plotted using suitable prompts in the search bar. A Lasso Tool can also be used to select a bunch of records plotted on the map at once.
The working of Overlay in Maplytics
A comparative analysis of Dynamics 365 CRM data on a map can be performed by plotting layers. Viewing layers of plotted data makes decision-making robust. Using Overlay, you are enabled to plot Shape files or territories. These shape files need to be saved in a territory to be visible in the list of shape files in the environment. With the help of Shape operations, users can perform Binary operations such as Difference, Intersection, Union, Union Aggregate, and Distinctive Union on the shapes drawn on the map. The ArcGIS Feature Layers can also be plotted on the map. They are picked live and need not be saved to be visible.
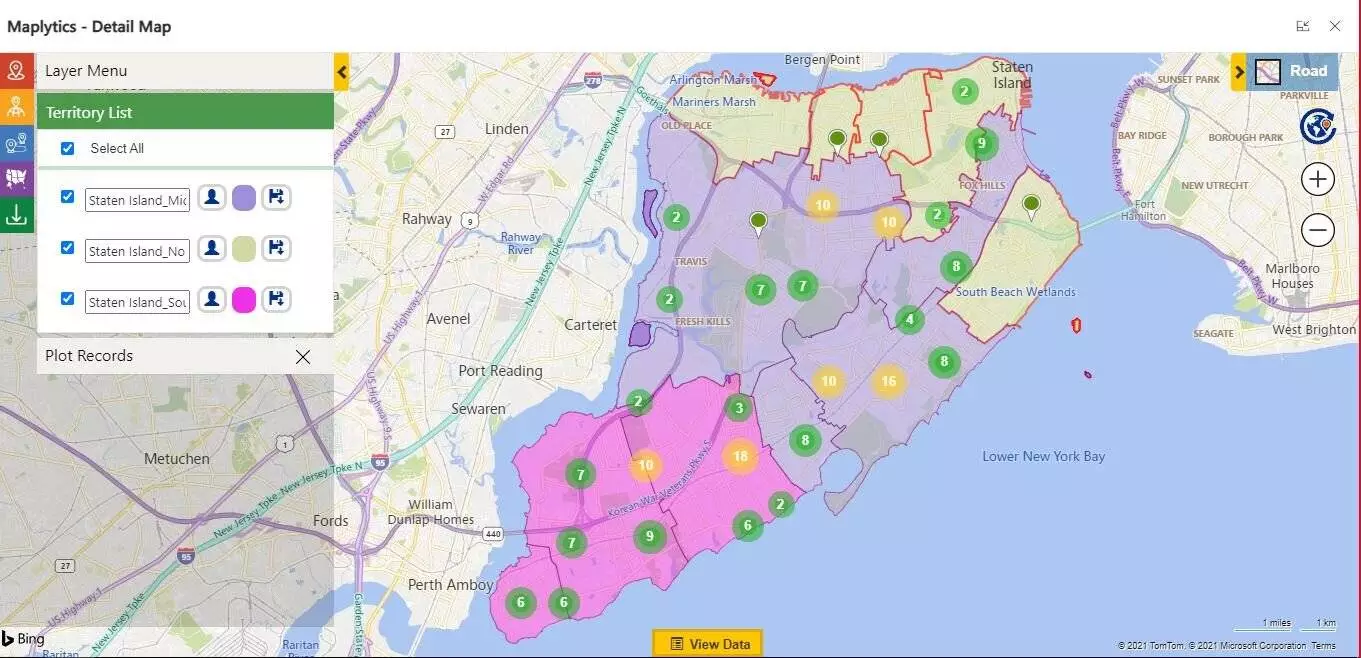
Territory plotting on a map
You can plot saved territories on a map. You can use the alignment tool within Microsoft Dynamics 365 CRM and create or align territories. Using the alignment tool enables users to perform multiple actions like ‘select, deselect, select all, and delete’ on the plotted territories.
FAQ's

Can I view individual territories assigned to the records on map?
Yes, you can quickly view the individual territories saved within the CRM on map with our mapping app Maplytics. Moreover, you can also view Dynamics 365 CRM records assigned with the respective territories.
Can I view my CRM data, territories and shape files together on map?
With the overlay feature of Maplytics you can view the records, territories and shape files together on map. This give the capability to the users to make strategic decisions regarding what campaigns or activities they want to perform with their Dynamics 365 CRM data.
Can I visualize Dynamics 365 data based on regions?
Yes, Maplytics allows you to plot existing Dynamics 365 CRM records into regions like City, State, County, etc. on map and see in what regions they lie. This allows to further define the regions into geographies and draw territories out of these geographies.
How to visualize Dynamics 365 CRM data on map?
With Maplytics you can visualize the CRM data on map plotted as pushpins based on their latitude and longitude. This gives you the capability to locate any Dynamics 365 CRM data on map quickly and apply multiple Maplytics actions on them.